Strategy Tester Report
AlpariUK-Demo (Build 225)
| Symbol | EURUSD (Euro vs US Dollar) | ||||
| Period | 1 Hour (H1) 2009.12.01 00:00 - 2010.01.15 22:00 (2009.12.01 - 2010.01.17) | ||||
| Model | Control points (a very crude method, the results must not be considered) | ||||
| Parameters | BeginSession1=6; EndSession1=10; BeginSession2=10; EndSession2=14; TrailingStop=0; TakeProfit=0; InitialStopLoss=40; | ||||
| Bars in test | 1753 | Ticks modelled | 19953 | Modelling quality | n/a |
| Mismatched charts errors | 1 | ||||
| Initial deposit | 10000.00 | ||||
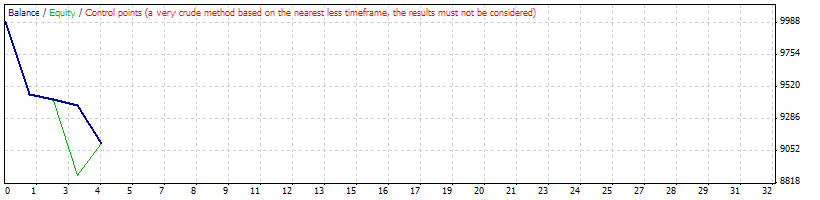
| Total net profit | -890.00 | Gross profit | 0.00 | Gross loss | -890.00 |
| Profit factor | 0.00 | Expected payoff | -222.50 | ||
| Absolute drawdown | 1106.80 | Maximal drawdown | 1106.80 (11.07%) | Relative drawdown | 11.07% (1106.80) |
| Total trades | 4 | Short positions (won %) | 2 (0.00%) | Long positions (won %) | 2 (0.00%) |
| Profit trades (% of total) | 0 (0.00%) | Loss trades (% of total) | 4 (100.00%) | ||
| Largest | profit trade | 0.00 | loss trade | -531.80 | |
| Average | profit trade | 0.00 | loss trade | -222.50 | |
| Maximum | consecutive wins (profit in money) | 0 (0.00) | consecutive losses (loss in money) | 4 (-890.00) | |
| Maximal | consecutive profit (count of wins) | 0.00 (0) | consecutive loss (count of losses) | -890.00 (4) | |
| Average | consecutive wins | 0 | consecutive losses | 4 | |
| # | Time | Type | Order | Size | Price | S / L | T / P | Profit | Balance |
| 1 | 2010.01.12 10:00 | buy stop | 1 | 1.00 | 1.45452 | 0.00000 | 0.00000 | ||
| 2 | 2010.01.12 10:00 | sell stop | 2 | 1.00 | 1.43953 | 0.00000 | 0.00000 | ||
| 3 | 2010.01.12 16:50 | buy | 1 | 1.00 | 1.45452 | 0.00000 | 0.00000 | ||
| 4 | 2010.01.12 23:59 | expiration | 2 | 1.00 | 1.43953 | 0.00000 | 0.00000 | ||
| 5 | 2010.01.13 00:00 | close | 1 | 1.00 | 1.44920 | 0.00000 | 0.00000 | -531.80 | 9468.20 |
| 6 | 2010.01.13 10:00 | buy stop | 3 | 1.00 | 1.44927 | 0.00000 | 0.00000 | ||
| 7 | 2010.01.13 10:00 | sell stop | 4 | 1.00 | 1.44721 | 0.00000 | 0.00000 | ||
| 8 | 2010.01.13 10:10 | buy | 3 | 1.00 | 1.44927 | 0.00000 | 0.00000 | ||
| 9 | 2010.01.13 11:00 | modify | 3 | 1.00 | 1.44927 | 1.44887 | 0.00000 | ||
| 10 | 2010.01.13 11:07 | s/l | 3 | 1.00 | 1.44887 | 1.44887 | 0.00000 | -40.00 | 9428.20 |
| 11 | 2010.01.13 14:00 | sell stop | 5 | 1.00 | 1.45069 | 0.00000 | 0.00000 | ||
| 12 | 2010.01.13 16:20 | sell | 5 | 1.00 | 1.45069 | 0.00000 | 0.00000 | ||
| 13 | 2010.01.13 17:00 | modify | 5 | 1.00 | 1.45069 | 1.45109 | 0.00000 | ||
| 14 | 2010.01.13 17:50 | sell | 4 | 1.00 | 1.44721 | 0.00000 | 0.00000 | ||
| 15 | 2010.01.13 18:20 | s/l | 5 | 1.00 | 1.45109 | 1.45109 | 0.00000 | -40.00 | 9388.20 |
| 16 | 2010.01.14 00:00 | close | 4 | 1.00 | 1.44998 | 0.00000 | 0.00000 | -278.20 | 9110.00 |
| 17 | 2010.01.14 14:00 | buy stop | 6 | 1.00 | 1.45452 | 0.00000 | 0.00000 | ||
| 18 | 2010.01.14 23:59 | expiration | 6 | 1.00 | 1.45452 | 0.00000 | 0.00000 | ||
| 19 | 2010.01.15 10:00 | buy stop | 7 | 1.00 | 1.45163 | 0.00000 | 0.00000 | ||
| 20 | 2010.01.15 14:00 | buy stop | 8 | 1.00 | 1.45118 | 0.00000 | 0.00000 | ||