#00_ZZ_Window
Download script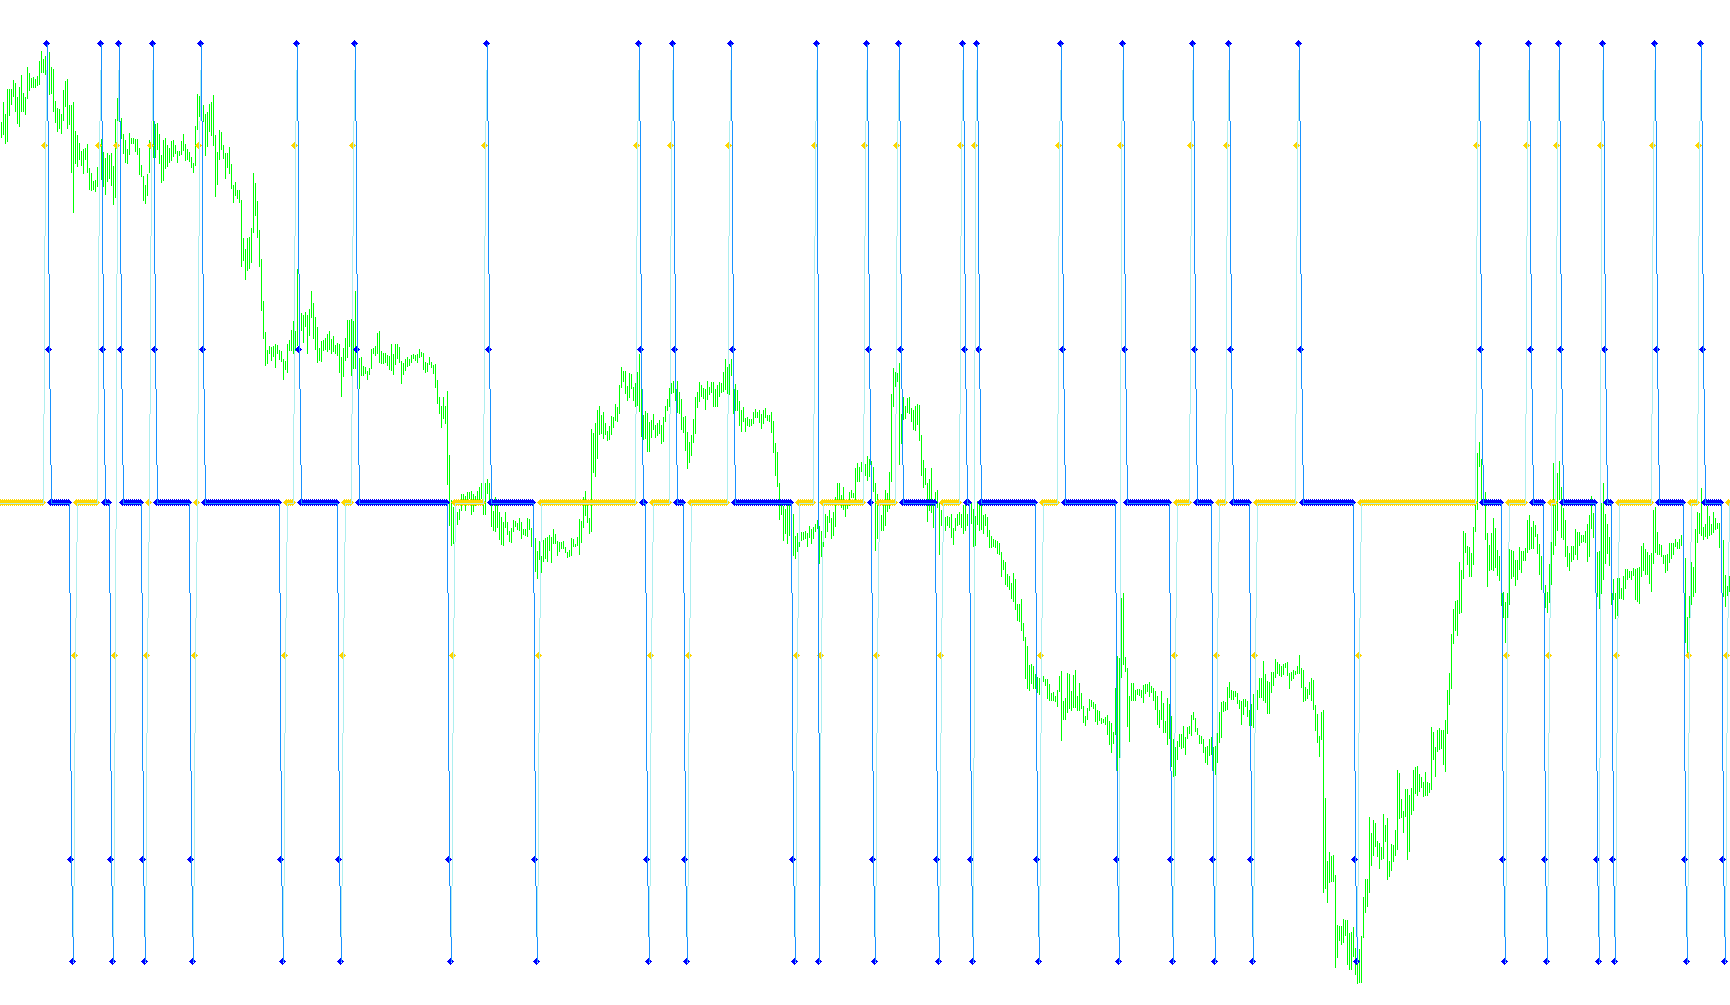
This script functions as a specialized visual charting tool designed to identify and map significant price fluctuations, specifically focusing on "swings" or major structural turns in the market. It simplifies complex price movements into a readable format by filtering out minor market noise and highlighting key turning points.
How the Logic Works
1. Identifying Peak and Valley Points The script begins by scanning historical price data to locate significant highs and lows. Instead of reacting to every tiny price movement, it uses three specific parameters—Depth, Deviation, and Backstep—to act as a filter. This ensures that only movements large enough to be considered meaningful are captured. It looks for "true" peaks (the highest points in a local area) and "true" valleys (the lowest points), effectively ignoring the small "wiggles" of everyday trading.
2. Dynamic Structure Cleaning Once potential high and low points are identified, the script performs a refinement process. It evaluates these points against one another to ensure they form a logical sequence. For instance, if a new high is discovered that is higher than a previously recorded high in the same area, the script "cuts" or removes the old point to maintain a clean, connected structural path. This prevents the chart from looking cluttered and ensures that the resulting lines represent the most significant price trends.
3. Trend Direction Analysis After establishing the primary peaks and valleys, the logic determines the current market trend by comparing the relationship between these points. It creates a binary "signal" state: identifying whether the price is currently moving in an upward or downward trajectory based on the sequence of the last established structural turn.
4. Visual Signal Generation The final stage of the script translates this mathematical analysis into visual cues on your chart. Based on the trend signals and the proximity of previous turning points, it places specific markers (such as arrows or dots) and draws lines. These visual elements are programmed to appear at varying "intensities" or positions depending on how many bars have passed since the last major turn.
In essence, this tool automates the tedious process of manually identifying support and resistance levels by distilling raw price data into a clean, structural map of market momentum.
//+------------------------------------------------------------------+
//|                                                                  |
//|                                                                  |
//|                                                                  |
//+------------------------------------------------------------------+
#property copyright "Copyright © 2005, MetaQuotes Software Corp."
#property link      "http://www.metaquotes.net/"

#property indicator_separate_window
#property indicator_minimum -100
#property indicator_maximum 100
#property indicator_buffers 4
#property indicator_color1 Blue
#property indicator_color2 Red
#property indicator_color3 Blue
#property indicator_color4 Red
//---- indicator parameters
extern int ExtDepth=12;
extern int ExtDeviation=5;
extern int ExtBackstep=3;
//---- indicator buffers
double ExtMapBuffer1[];
double ExtMapBuffer2[];
double ExtMapBuffer3[];
double ExtMapBuffer4[];
double ExtMapBuffer5[];
double ExtMapBuffer6[];
double zz[];

//+------------------------------------------------------------------+
//| Custom indicator initialization function                         |
//+------------------------------------------------------------------+
int init()
  {
   IndicatorBuffers(7);
//---- drawing settings
   SetIndexStyle(0,DRAW_ARROW);
   SetIndexArrow(0,119);
   SetIndexBuffer(0,ExtMapBuffer3);
   SetIndexEmptyValue(0,0.0);
   SetIndexStyle(1,DRAW_ARROW);
   SetIndexArrow(1,119);
   SetIndexBuffer(1,ExtMapBuffer4);
   SetIndexEmptyValue(1,0.0);
   SetIndexStyle(2,DRAW_LINE);
   SetIndexBuffer(2,ExtMapBuffer5);
   SetIndexEmptyValue(2,0.0);
   SetIndexStyle(3,DRAW_LINE);
   SetIndexBuffer(3,ExtMapBuffer6);
   SetIndexEmptyValue(3,0.0);
//---- indicator buffers mapping
   SetIndexBuffer(4,ExtMapBuffer1);
   SetIndexBuffer(5,ExtMapBuffer2);
   SetIndexBuffer(6,zz);
   SetIndexEmptyValue(0,0.0);
   SetIndexEmptyValue(1,0.0);
   SetIndexEmptyValue(2,0.0);
   ArraySetAsSeries(ExtMapBuffer1,true);
   ArraySetAsSeries(ExtMapBuffer2,true);
//---- indicator short name
IndicatorShortName("00 Zig Zag");
//---- initialization done
   return(0);
  }
  int deinit() {return(0);}

//+------------------------------------------------------------------+
//|                                                                  |
//+------------------------------------------------------------------+
int start()
  {
   int    shift, back,lasthighpos,lastlowpos;
   double val,res;
   double curlow,curhigh,lasthigh,lastlow;
   bool signal;
   int i;

   for(shift=Bars-ExtDepth; shift>=0; shift--)
     {
      val=Low[Lowest(NULL,0,MODE_LOW,ExtDepth,shift)];
      if(val==lastlow) val=0.0;
      else
        {
         lastlow=val;
         if((Low[shift]-val)>(ExtDeviation*Point)) val=0.0;
         else
           {
            for(back=1; back<=ExtBackstep; back++)
              {
               res=ExtMapBuffer1[shift+back];
               if((res!=0)&&(res>val)) ExtMapBuffer1[shift+back]=0.0;
              }
           }
        }
      ExtMapBuffer1[shift]=val;
      //--- high
      val=High[Highest(NULL,0,MODE_HIGH,ExtDepth,shift)];
      if(val==lasthigh) val=0.0;
      else
        {
         lasthigh=val;
         if((val-High[shift])>(ExtDeviation*Point)) val=0.0;
         else
           {
            for(back=1; back<=ExtBackstep; back++)
              {
               res=ExtMapBuffer2[shift+back];
               if((res!=0)&&(res<val)) ExtMapBuffer2[shift+back]=0.0;
              }
           }
        }
      ExtMapBuffer2[shift]=val;
     }

   // final cutting
   lasthigh=-1; lasthighpos=-1;
   lastlow=-1;  lastlowpos=-1;

   for(shift=Bars-ExtDepth; shift>=0; shift--)
     {
      curlow=ExtMapBuffer1[shift];
      curhigh=ExtMapBuffer2[shift];
      if((curlow==0)&&(curhigh==0)) continue;
      //---
      if(curhigh!=0)
        {
         if(lasthigh>0)
           {
            if(lasthigh<curhigh) ExtMapBuffer2[lasthighpos]=0;
            else ExtMapBuffer2[shift]=0;
           }
         //---
         if(lasthigh<curhigh || lasthigh<0)
           {
            lasthigh=curhigh;
            lasthighpos=shift;
           }
         lastlow=-1;
        }
      //----
      if(curlow!=0)
        {
         if(lastlow>0)
           {
            if(lastlow>curlow) ExtMapBuffer1[lastlowpos]=0;
            else ExtMapBuffer1[shift]=0;
           }
         //---
         if((curlow<lastlow)||(lastlow<0))
           {
            lastlow=curlow;
            lastlowpos=shift;
           }
         lasthigh=-1;
        }
     }

   for(shift=Bars-1; shift>=0; shift--)
     {
      if(shift>=Bars-ExtDepth) {ExtMapBuffer1[shift]=0.0;ExtMapBuffer2[shift]=0.0;}
      else
        {
         if (ExtMapBuffer1[shift]>0) {signal=true;}
         res=ExtMapBuffer2[shift];
         if(res!=0.0) {ExtMapBuffer1[shift]=res;signal=false;}
        }
        if (signal)
          {
           zz[shift]=-1;
          }
        else
          {
           zz[shift]=1;
          }
     }

// âûâîä

   for(shift=Bars-4; shift>=0; shift--)
     {
      if (zz[shift]<0)
        {

         if (zz[shift+2]>0)
           {
            if (zz[shift+1]>0)
              {
               ExtMapBuffer4[shift+1]=-70;
               ExtMapBuffer6[shift+1]=-70;
               ExtMapBuffer4[shift]=-90;
               ExtMapBuffer6[shift]=-90;
               ExtMapBuffer3[shift]=-90;
               ExtMapBuffer5[shift]=-90;
              }
            else
              {
               ExtMapBuffer3[shift]=-30;
               ExtMapBuffer5[shift]=-30;
              }
           }
         else
           {
            if (zz[shift+1]>0)
              {
               ExtMapBuffer3[shift]=-90;
               ExtMapBuffer5[shift]=-90;
               ExtMapBuffer4[shift]=-90;
               ExtMapBuffer6[shift]=-90;
              }
            else
              {
               ExtMapBuffer3[shift]=0.001;
               ExtMapBuffer5[shift]=0.001;
              }
           }

        }
      else
        {
         if (zz[shift+2]>0)
           {
            if (zz[shift+1]>0)
              {
               ExtMapBuffer4[shift]=0.001;
               ExtMapBuffer6[shift]=0.001;
              }
            else
              {
               ExtMapBuffer3[shift]=90;
               ExtMapBuffer5[shift]=90;
               ExtMapBuffer4[shift]=90;
               ExtMapBuffer6[shift]=90;
              }
           }
         else
           {
            if (zz[shift+1]>0)
              {
               ExtMapBuffer4[shift]=30;
               ExtMapBuffer6[shift]=30;
              }
            else
              {
               ExtMapBuffer3[shift+1]=70;
               ExtMapBuffer5[shift+1]=70;
               ExtMapBuffer3[shift]=90;
               ExtMapBuffer5[shift]=90;
               ExtMapBuffer4[shift]=90;
               ExtMapBuffer6[shift]=90;
              }
           }
        }

     }
  }
Comments