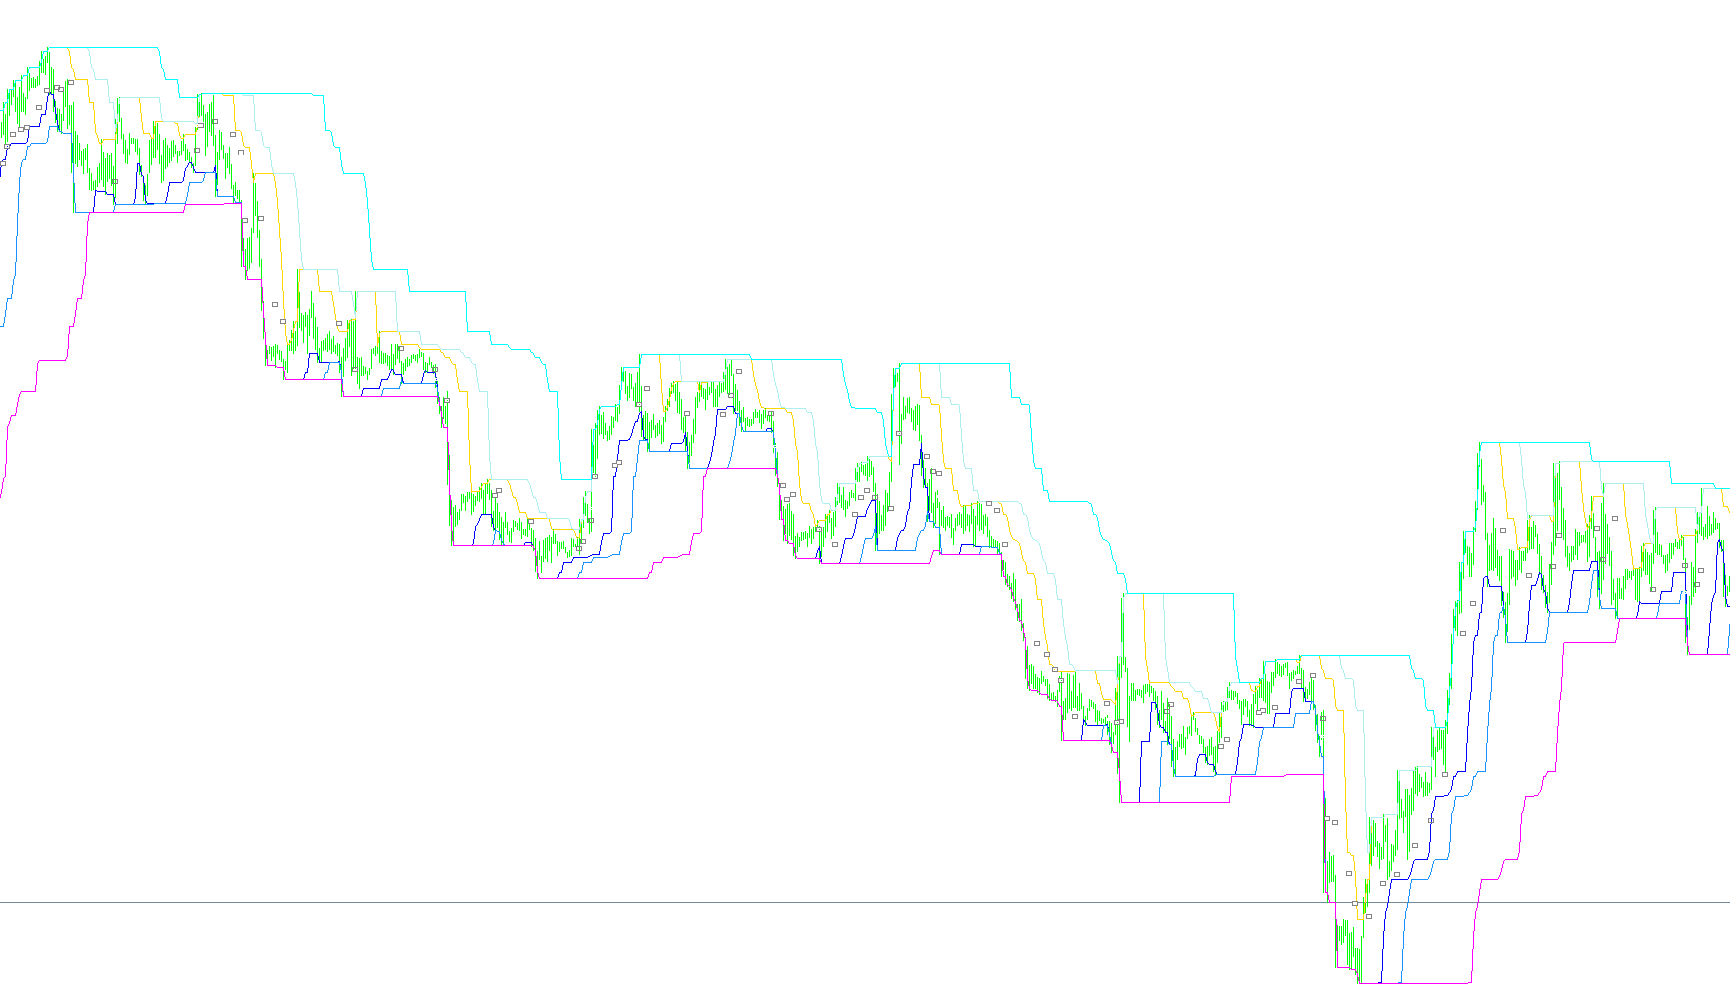
! FanSimple8 for me
Indicator

! FanSimple8 for me

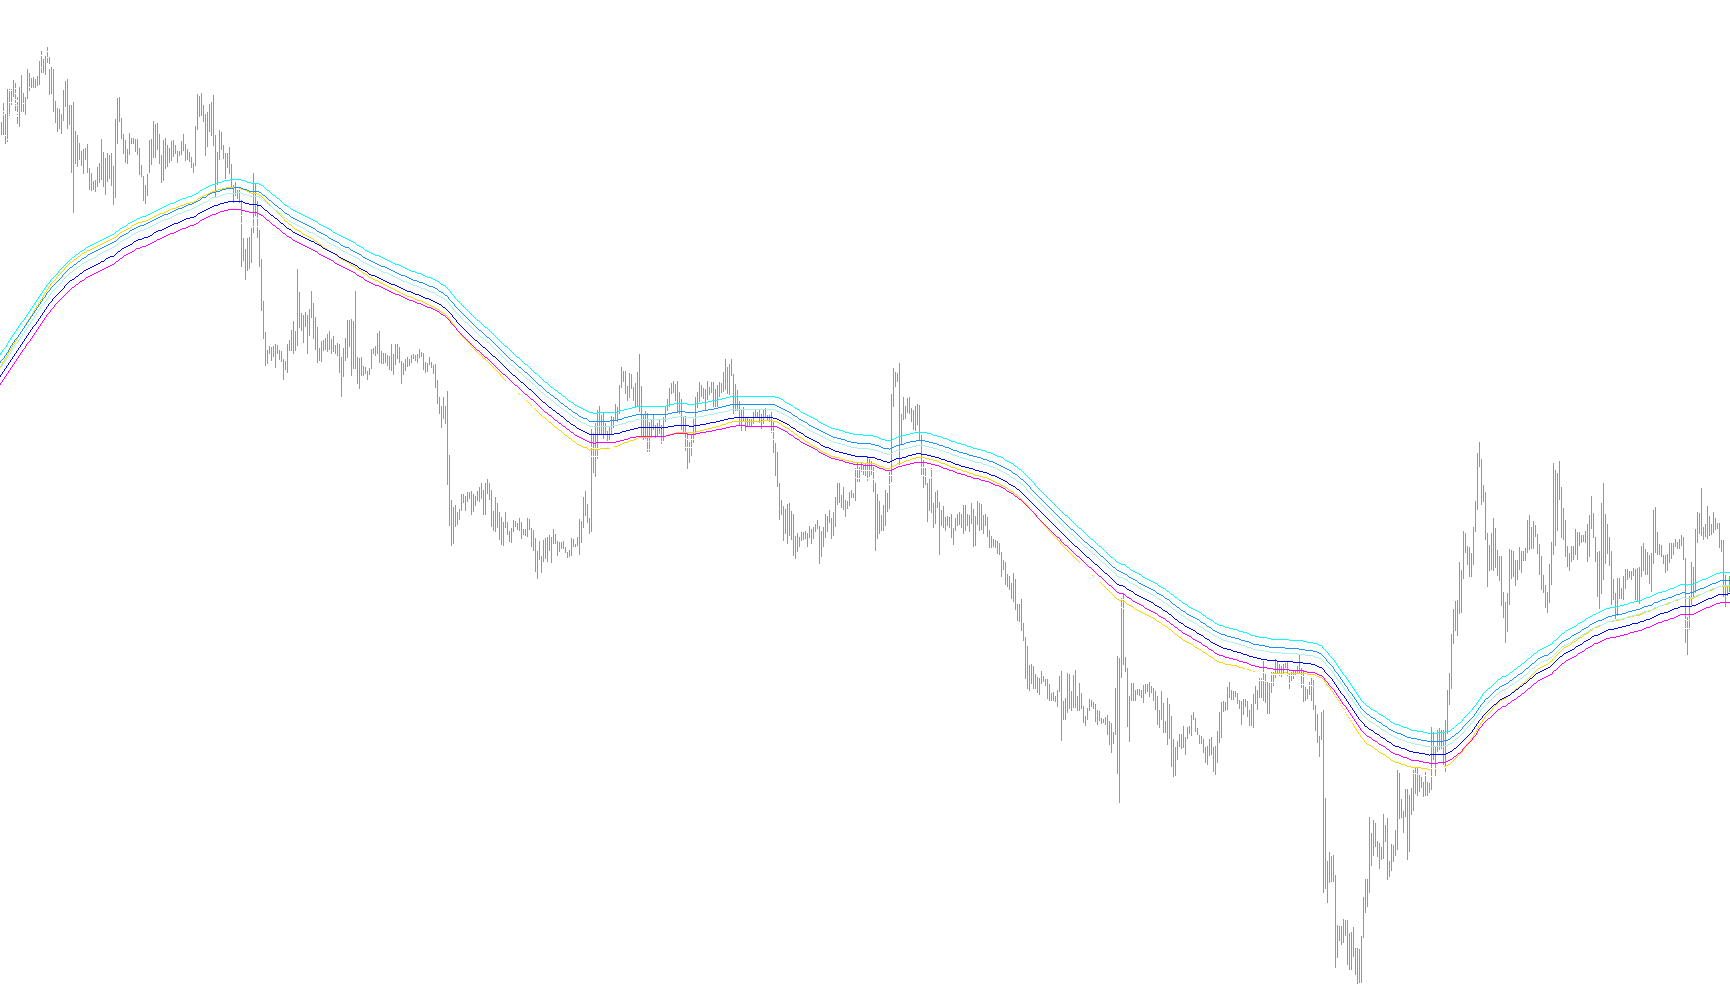
iMA
!! [i] Darma_Bollatr
Indicator

!! [i] Darma_Bollatr

iBandsiATRiMA
!!!News
Indicator

!!!News

Automates the simultaneous opening of high-priority economic calendar and financial news portals in the system's default browser.

!!channel_breakout_atr
Indicator

!!channel_breakout_atr

iATR

This indicator identifies channel breakouts based on price crossing high/low of defined periods and plots potential pyramiding entry points using ATR multiples for stop loss and position sizing, adjusted for spread.

!!channel_breakout_atr_v1
Indicator

!!channel_breakout_atr_v1

iATR

This indicator identifies multi-stage trend breakouts by plotting dynamic price levels based on rolling highs, lows, and ATR-adjusted risk buffers.

!!channel_breakout_basic
Indicator

!!channel_breakout_basic

iATR

This MetaTrader indicator identifies potential entry points based on channel breakouts calculated over different periods, using ATR to determine initial stop-loss levels according to turtle trading principles.

!!channel_breakout_basic_v1
Indicator

!!channel_breakout_basic_v1

iATR
!!ZigZagTriad
Indicator

!!ZigZagTriad

Identifies significant price structural extremes by filtering local high and low peaks based on specific depth and deviation thresholds to map market swings.

!
Indicator

!

iMAOnArrayiRSI
!Control
Indicator

!Control

This script facilitates real-time graphical object parity across multiple trading terminals by serializing and replicating visual elements via shared file buffers.

!corelation
Indicator

!corelation

iMA
!LinRegrBuf
Indicator

!LinRegrBuf

This indicator calculates a linear least-squares regression line and projects parallel support and resistance boundaries based on the maximum historical deviation within a user-defined period.

!MoneyLine2
Indicator

!MoneyLine2

iMA
Indicator

!Report_v3

!RES-SUP
Indicator

!RES-SUP

iATR

This indicator identifies priority support and resistance levels by calculating the arithmetic mean of previous daily candles and applying Fibonacci-based offsets to the high-low range.

!Rsi prognoz
Indicator

!Rsi prognoz

This indicator analyzes past RSI patterns to forecast future RSI values based on historical similarities within a specified timeframe and error tolerance.

!siLagrange
Indicator

!siLagrange

The indicator identifies significant structural peaks or troughs and uses Lagrange interpolation to model the underlying price curve for predictive trend projection.

!siLagrangePnt
Indicator

!siLagrangePnt

This indicator constructs a mathematical curve using Lagrange interpolation based on user-defined arrow objects to project future price trends.

!SupportingADX
Indicator

!SupportingADX

This indicator quantifies the intensity of market movement by smoothing the relative difference between positive and negative price trends against the total true range.

!SupportingMACD
Indicator

!SupportingMACD

iMAiMAOnArray
!Writer
Indicator

!Writer

This script synchronizes the active trading status across multiple terminal instances by toggling specific global variables based on unique symbol and timeframe identifiers.

!xMeter Indy v07
Indicator

!xMeter Indy v07

!xMeter
Indicator

!xMeter

This indicator calculates and visualizes the relative power of major currencies by analyzing daily price ranges and cross-pair correlations to populate a dynamic dashboard.

!xMeter_mini
Indicator

!xMeter_mini

This indicator aggregates real-time price action across twelve major forex pairs to calculate and visualize the relative strength of individual currencies using a weighted grade system.

!xMeter_mini1
Indicator

!xMeter_mini1

This tool dynamically quantifies the relative strength of major currencies by calculating and visualizing daily price action ratios across a multi-pair matrix.

!xMeter_v1
Indicator

!xMeter_v1

The algorithm quantifies the relative momentum of major currencies by calculating the weighted average of their individual price ratios across a diverse set of forex pairs.

Indicator

!_BZ_everyhour

!_EA_Vegas_1hr
Indicator

!_EA_Vegas_1hr

iMA
!_EA_Vegas_1hr_v1
Indicator

!_EA_Vegas_1hr_v1

iMA
!_EA_Vegas_1hr_v2
Indicator

!_EA_Vegas_1hr_v2

iMA
Indicator

!_EZtoRead_Template

!_HULL_MA
Indicator

!_HULL_MA

iMAiMAOnArray
!_Macd
Indicator

!_Macd

iMAiMAOnArray
!_MTF PCCI-as a filter
Indicator

!_MTF PCCI-as a filter

This indicator calculates the discrepancy between current price action and a weighted historical average to isolate underlying price noise.

Indicator

!_MTF_ATR

iATR
Indicator

!_MTF_Fractal

iFractals
!_rdb_Spread_Hi_Lo
Indicator

!_rdb_Spread_Hi_Lo

iMA
!_rdb_Spread_Hi_Lo_v1
Indicator

!_rdb_Spread_Hi_Lo_v1

iMA
!_rdb_Spread_Hi_Lo_v1a
Indicator

!_rdb_Spread_Hi_Lo_v1a

iMA
!_v0.10
Indicator

!_v0.10

iMAOnArrayiRSI
# aa_ZigZag Pointer
Indicator

# aa_ZigZag Pointer

Identifies significant structural price extremes by iteratively filtering historical highs and lows based on recursive depth, deviation thresholds, and backstep constraints.

# KeyLevels
Indicator

# KeyLevels

This indicator calculates and plots symmetrical price boundaries at fixed point increments based on the ceiling of current market closing prices.

# Murrey Math Black
Indicator

# Murrey Math Black

This indicator segments the current trading range into eight distinct octave-based zones to identify structural pivots, momentum stalls, and potential reversal levels.

Indicator

# OTCFX_b-clock modified V2.2

Indicator

# OTCFX_b-clock modified V3.2-sw

Indicator

# OTCFX_b-clock modified V3.2-sw_v1

Indicator

# OTCFX_b-clock modified V4-sw

# TLB OC v02
Indicator

# TLB OC v02

This indicator dynamically identifies and plots historical support and resistance levels across multiple timeframes by detecting structural trendline breaks and peak price pivots.

## New Pivot ZeroUp ##
Indicator

## New Pivot ZeroUp ##

This indicator dynamically projects daily, weekly, and monthly pivot points along with associated support and resistance levels based on historical high, low, and close price data.

###Auto Pivot
Indicator

###Auto Pivot

This indicator dynamically plots daily, weekly, and monthly pivot points along with their corresponding support and resistance levels while automatically correcting for weekend data discrepancies.