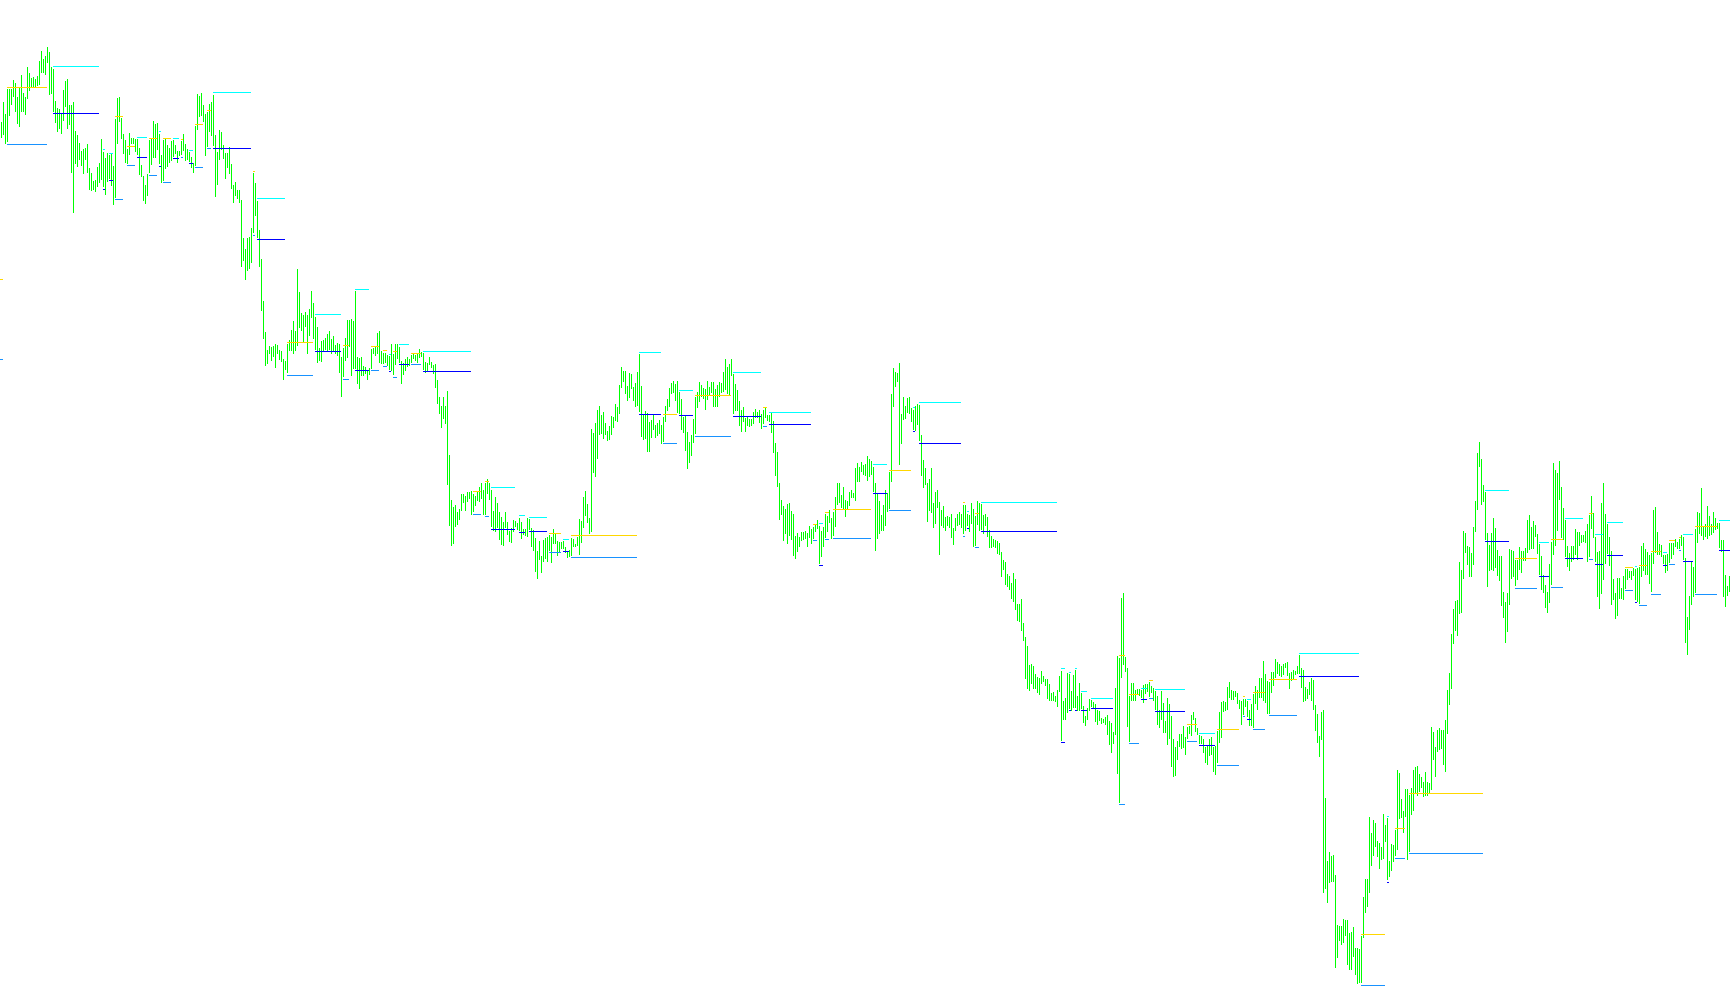
This technical script functions as a visual trading signal indicator designed to identify potential momentum shifts in the market. It uses a standard momentum oscillator (the CCI) to detect when the price is moving with sufficient strength to suggest a change in direction, specifically focusing on "crosses" between positive and negative territory.
Core Logic and Functionality
Momentum Detection The script constantly monitors the market's momentum by comparing the current value of the CCI indicator against its value from the previous candle. It is looking for specific "breakout" points where the momentum flips from one side of the zero line to the other.
Buy Signals (Bullish) The logic identifies a potential "Buy" opportunity when the momentum indicator moves from a negative state (below zero) to a positive state (above zero). When this crossover occurs, the script places a visual marker above the current price candle. Additionally, it calculates a suggested safety level (Stop Loss) based on the low of that specific candle.
Sell Signals (Bearish) Conversely, the script identifies a potential "Sell" opportunity when the momentum indicator moves from a positive state (above zero) to a negative state (below zero). When this happens, it places a visual marker below the current price candle and calculates a suggested safety level based on the high of that candle.
Visual Presentation To keep the chart clean and actionable, the script manages several data layers:
- Entry Markers: It highlights specific candles where the momentum flip occurs so traders can quickly spot entry points.
- Dynamic Support/Resistance: By tracking the "High" and "Low" of the signal candles, the script helps provide a visual reference for potential exit points or areas where price action might reverse.
- Data Cleaning: The logic ensures that when a new signal is generated, any previous opposing signals are cleared from the display to prevent chart clutter and ensure only the most relevant current data is visible.
Summary for Traders
In simple terms, this tool acts as a "momentum trigger." It waits for the market's strength to swing from negative to positive (Buy) or positive to negative (Sell), then marks those specific moments on your chart with visual cues, helping you identify potential trends and corresponding safety levels in real-time.
//+------------------------------------------------------------------+

//+------------------------------------------------------------------+
#property copyright ""

#property indicator_chart_window
#property indicator_buffers 5
#property indicator_color1 Blue
#property indicator_color2 Red
#property indicator_color3 Green
#property indicator_color4 SlateGray
#property indicator_color5 DimGray

#property indicator_style4     2
#property indicator_style5     2

double dUpCCIBuffer[];
double dDownCCIBuffer[];
double dSellBuffer[];
double dUpCCIBufferSL[];
double dDnCCIBufferSL[];


extern int CCI_Period = 14;  //This value sets the CCI Period Used, The default is 21
extern int PointLevel = 10;
//extern int atrlevel = 0.7;

int RowNum = 0;
int LastTrend = -1;
int UP_IND    = 1;
int DOWN_IND  = 0;

//+------------------------------------------------------------------+
//| Custom indicator initialization function                         |
//+------------------------------------------------------------------+
int init()
  {
//---- indicator buffers mapping
    SetIndexBuffer(0,dUpCCIBuffer);
    SetIndexBuffer(1,dDownCCIBuffer);
    SetIndexBuffer(2,dSellBuffer);
    SetIndexBuffer(3,dUpCCIBufferSL);
    SetIndexBuffer(4,dDnCCIBufferSL);

//---- drawing settings
/*
    SetIndexStyle(0,DRAW_ARROW);
    SetIndexArrow(0,233); //241 option for different arrow head
    SetIndexStyle(1,DRAW_ARROW);
    SetIndexArrow(1,234); //242 option for different arrow head
    SetIndexStyle(2,DRAW_ARROW);
    SetIndexArrow(2,252);  //251 x sign or 252 green check
    SetIndexStyle(3,DRAW_LINE);
*/
//----
    SetIndexEmptyValue(0,0.0);
    SetIndexEmptyValue(1,0.0);
    SetIndexEmptyValue(2,0.0);
    SetIndexEmptyValue(3,0.0);
    SetIndexEmptyValue(4,0.0);
//---- name for DataWindow
    SetIndexLabel(0,"CCI Buy");
    SetIndexLabel(1,"CCI Sell");
    SetIndexLabel(2,"Exit");
//----


   return(0);
  }
//+------------------------------------------------------------------+
//| Custor indicator deinitialization function                       |
//+------------------------------------------------------------------+
int deinit()
  {
//----
//----
   return(0);
  }


//+------------------------------------------------------------------+
//| Custom indicator iteration function                              |
//+------------------------------------------------------------------+
int start()
  {
   int nBars,nCountedBars;

    nCountedBars=IndicatorCounted(); //ncountedbars 655
//---- check for possible errors
    if(nCountedBars<0) return(-1);
//---- last counted bar will be recounted
    if(nCountedBars<=3)
       nBars=Bars-nCountedBars-4;

    if(nCountedBars>2)
      {
       nCountedBars--;
       nBars=Bars-nCountedBars-1; //number of bars in current chart-655-1
      }

int lastCloseLong=0;
int lastCloseShort=0;

   for (int ii=Bars; ii>0; ii--)
   {

      dUpCCIBuffer[ii]=dUpCCIBuffer[ii+1];
      dDownCCIBuffer[ii]=dDownCCIBuffer[ii+1];
         dUpCCIBufferSL[ii]=dUpCCIBufferSL[ii+1];
         dDnCCIBufferSL[ii]=dDnCCIBufferSL[ii+1];


      double myCCInow = iCCI(NULL,0,CCI_Period,PRICE_CLOSE,ii);
      double myCCI2 = iCCI(NULL,0,CCI_Period,PRICE_CLOSE,ii+1); //CCI One bar ago


      if (myCCInow>=0) //is going long
      {
         if(myCCInow>0 && myCCI2<0) //did it cross from below 50
         {

            dUpCCIBuffer[ii]  = High[ii] + PointLevel * MarketInfo(Symbol(),MODE_POINT);

            dUpCCIBufferSL[ii] = Low[ii] - PointLevel * MarketInfo(Symbol(),MODE_POINT);
            dDownCCIBuffer[ii]   =0.0;
            dDnCCIBufferSL[ii]  =0.0;
         }

      }

      if(myCCInow<0)  //is going short
      {
         if(myCCInow<0 && myCCI2>0) //did it cross from above 50
         {

            dDownCCIBuffer[ii] = Low[ii]-  PointLevel * MarketInfo(Symbol(),MODE_POINT);

            dDnCCIBufferSL[ii]  = High[ii]+  PointLevel * MarketInfo(Symbol(),MODE_POINT);
            dUpCCIBufferSL[ii]=0.0;

            dUpCCIBuffer[ii] = 0.0;

         }


      }


   }
}
Comments