_00FX Sniper's LSMA
Download script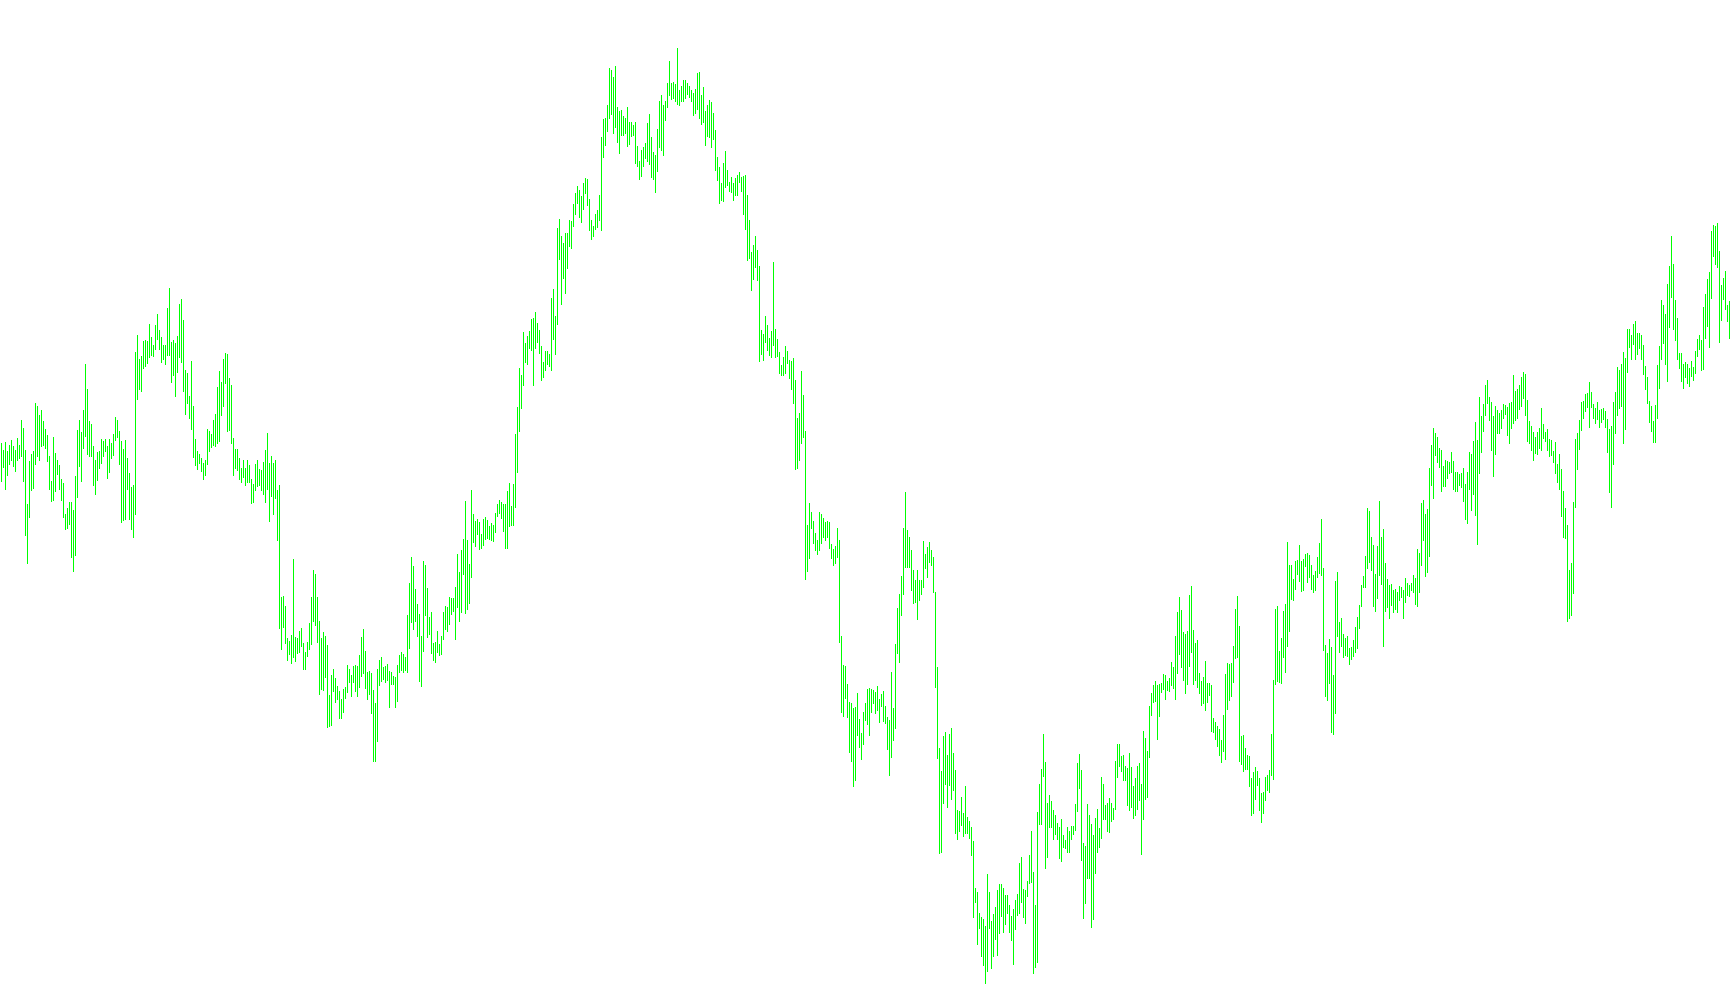
This technical tool is designed to provide a visual representation of market momentum and trend direction directly on your trading charts. It functions by analyzing historical price data to smooth out "noise," making it easier for traders to identify the underlying direction of the market at a glance.
Core Logic and Mechanism
The script operates using a weighted calculation method. Instead of simply looking at the most recent price, it examines a specific window of past data (defined by the period settings). It calculates a value based on three primary types of price action: Highs, Lows, or Closing prices, depending on the user's preference.
The key differentiator in this logic is the Weighting System:
- Rather than treating all days or hours of data equally, the tool assigns different levels of importance to each data point within its calculation window.
- By applying these weights, the tool focuses more effectively on recent price trends while still accounting for the preceding price history to ensure the movement is significant and not just a random fluctuation.
Visual Behavior and Interpretation
The primary goal of this script is to translate complex mathematical weightings into a clear, color-coded visual trend line:
- Trend Identification: The tool tracks the "movement" of the weighted value from one moment to the next.
- Dynamic Color Coding: The script automatically changes its visual output based on whether the current trend is moving upward or downward.
- When the calculated value increases compared to the previous point, the script highlights the movement in a specific color (Medium Sea Green).
- When the calculated value decreases, it switches the highlight to another color (Red).
- Smoothing Effect: Because the tool uses a weighted average, the resulting lines on your chart appear smoother than raw price action. This helps traders stay focused on the "big picture" of the market's flow rather than getting distracted by minor, insignificant price ticks.
Summary for the User
Essentially, this script acts as a visual filter. It takes raw market data, performs a weighted calculation to determine the strength and direction of the current trend, and paints a clear, color-coded path on your screen. This allows you to quickly see whether the market is currently gaining momentum or losing steam without having to manually calculate averages or interpret messy price movements.
//+------------------------------------------------------------------+
//|                                                        |
//|                      Copyright © 2004, MetaQuotes Software Corp. |
//|                                       http://www.metaquotes.net/ |
//+------------------------------------------------------------------+
#property  copyright "Copyright © 2005, FX Sniper "
#property  link      "http://www.metaquotes.net/"

//---- indicator settings
#property  indicator_chart_window
#property  indicator_buffers 2
#property indicator_color1 Red
#property indicator_color2 MediumSeaGreen


//---- buffers
double ExtMapBuffer1[];
double ExtMapBuffer2[];
extern int Rperiod = 14;
extern int Draw4HowLongg = 1500;
extern int Type = 3;
int Draw4HowLong,shift,i,loopbegin,width,length,c;
double sum[];
double lengthvar;
double tmp ;
double wt[];


//+------------------------------------------------------------------+
//| Custom indicator initialization function                         |
//+------------------------------------------------------------------+
int init()
  {
//---- 2 additional buffers are used for counting.
   IndicatorBuffers(4);

//---- drawing settings
   SetIndexBuffer(0,ExtMapBuffer1);
   SetIndexBuffer(1,ExtMapBuffer2);
   SetIndexBuffer(2,sum);
   SetIndexBuffer(3,wt);

   SetIndexStyle(0,DRAW_LINE,0,3);
   SetIndexStyle(1,DRAW_LINE,0,3);


//---- initialization done
   return(0);
  }

int start()

  {   Draw4HowLong = Bars-Rperiod - 5;
      length = Rperiod;
      loopbegin = Draw4HowLong - length - 1;

      for(shift = loopbegin; shift >= 0; shift--)
      {
         sum[1] = 0;
         for(i = length; i >= 1  ; i--)
         {
         lengthvar = length + 1;
         lengthvar /= 3;
         tmp = 0;
         if(Type==1)
         tmp = ( i - lengthvar)*High[length-i+shift];
         if (Type==2)
         tmp = ( i - lengthvar)*Low[length-i+shift];
         if(Type==3)
         tmp = ( i - lengthvar)*Close[length-i+shift];

         sum[1]+=tmp;
         }
         wt[shift] = sum[1]*6/(length*(length+1));

//========== COLOR CODING ===========================================

       ExtMapBuffer1[shift] = wt[shift];
       ExtMapBuffer2[shift] = wt[shift];

        if (wt[shift] > wt[shift+1])
        {
        ExtMapBuffer1[shift] = EMPTY_VALUE;
        ExtMapBuffer2[shift+1] = wt[shift+1];

        }
       else if (wt[shift] < wt[shift+1])
        {
        ExtMapBuffer2[shift] = EMPTY_VALUE;
        ExtMapBuffer1[shift+1] = wt[shift+1];
        }

      }

      return(0);
  }
//+------------------------------------------------------------------+
Comments