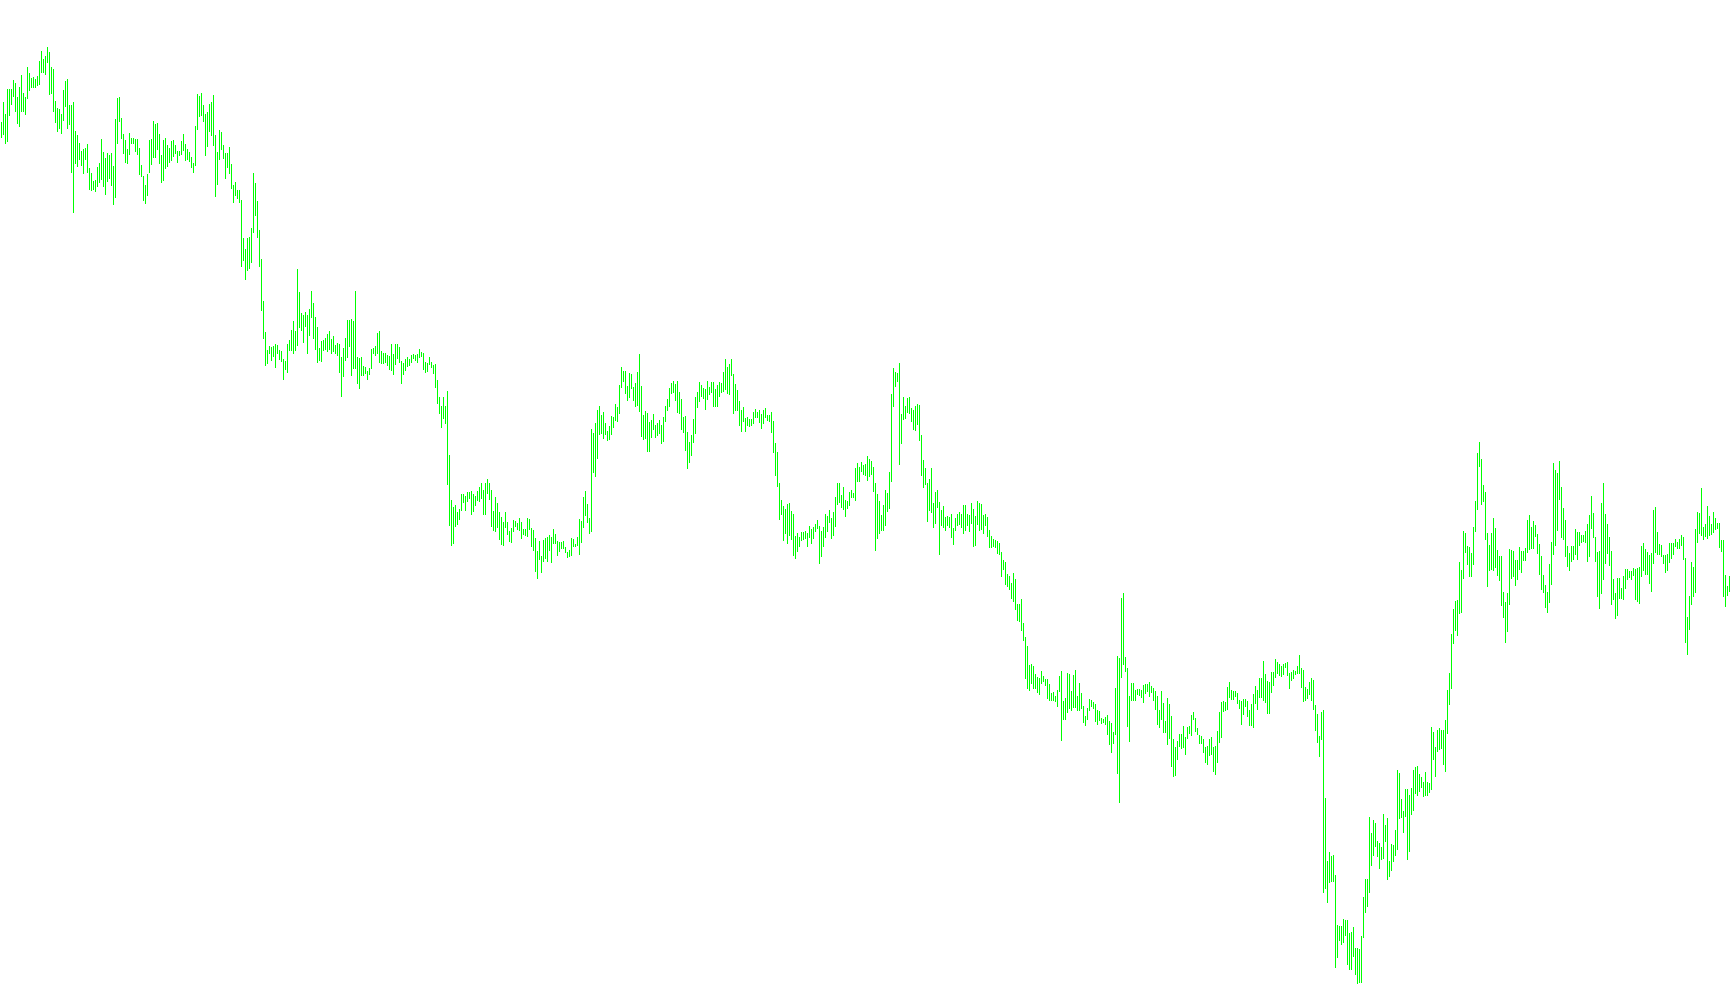
This script is designed to generate a Market Profile, a visual tool used by traders to analyze where price activity has been most concentrated over specific periods. Instead of just looking at the high and low prices, it maps out the "volume" of price action to identify significant zones of interest.
Core Logic Overview
The primary objective of the script is to scan historical price data and group it into distinct sessions. It calculates how often the market traded at specific price levels, effectively creating a "footprint" of the market's behavior.
1. Timeframe and Data Filtering The script operates within specific constraints to ensure accuracy. It filters the charts based on timeframes (specifically looking for intervals between 5 minutes and 60 minutes) and identifies the starting point of the analysis based on the user's defined date.
2. Session Identification The logic automatically distinguishes between different global trading sessions. It categorizes price movement into three specific regions:
- Asia: Trading activity occurring during early morning hours.
- Europe: Activity occurring during the midday period.
- America: Activity occurring during the late-day/overnight period.
3. Price Density Mapping The script iterates through every price level within a given day's range (from the high to the low). For every individual price point, it counts how many times the market touched or traded at that exact level.
- It identifies the Point of Balance, which is the price level where the highest concentration of trading activity occurred.
- It tracks the "size" of each session (Asia, Europe, and America) to determine the relative weight of activity for each region.
4. Visual Representation Once the script calculates the density of price action, it draws visual markers on your chart:
- Session Blocks: It creates colored rectangles that represent the duration and range of the Asia, Europe, and American sessions. Each session is assigned a unique color to allow for quick visual differentiation.
- Activity Tracking: By visualizing these blocks, the script helps you see where the market "spent the most time," allowing you to distinguish between low-liquidity noise and high-activity zones.
Summary for the User
In simple terms, this tool takes a messy chart of price movements and organizes it into a structured map. It tells you which price levels are the most "popular" (where the most trading happened) and visually segments those trades into geographical sessions. This helps traders identify support, resistance, and equilibrium points based on historical volume distribution rather than just simple price highs and lows.
//+------------------------------------------------------------------+
//|                                                MarketProfile.mq4 |
//|                             Copyright © 2006, Viatcheslav Suvorov|
//| Modified to better show "Points of Balance" by GodfreyH          |
//|                                                                  |
//| Cleaned up code, added DeleteObjects() to remove only the        |
//| objects created by this indicator and added settings for the     |
//| session/POC colors - mods by TwoBuckChuck                        |
//+------------------------------------------------------------------+
#property copyright "Viatcheslav Suvorov"

#property indicator_chart_window
#property indicator_buffers    1
#property indicator_color1     Yellow

extern datetime StartDate;// = D''; //removes the compiler warning
extern bool lastdayStart = true;
extern int CountProfile = 1;

// We all love custom settings
extern color Asia_Color    = Olive;
extern color Europe_Color  = Navy;
extern color US_Color      = Maroon;
extern color POC_Color     = Red;
extern int   POC_LineStyle = 0;//STYLE_DOT

int fontsize=10;
int i,j;
double LastHigh,LastLow,CurPos;
bool signal;
datetime flag;
string Obj_Prefix;
string Obj_Prefix1;
double buffer1[];
//+------------------------------------------------------------------+
//| Custor indicator deinitialization function                       |
//+------------------------------------------------------------------+
int deinit()
{
   DeleteObjects(); //only delete our objects
   return(0);
}
//+------------------------------------------------------------------+
//| Custom indicator initialization function                         |
//+------------------------------------------------------------------+
int init()
{
   string short_name;

   Obj_Prefix = "mp__"; //object prefix
   Obj_Prefix = "mp-poc"; //object prefix

   //---- name for DataWindow and indicator subwindow label
   short_name="MarketProfile";
   IndicatorShortName(short_name);
   SetIndexLabel(0,short_name);

   if (!StartDate) StartDate = TimeCurrent();
   SetIndexBuffer(0,buffer1);
   return(0);
}

//+------------------------------------------------------------------+
//| Custom indicator iteration function                              |
//+------------------------------------------------------------------+
int start()
{
   if (flag!=Time[0]) // Calculate on new bar.
   {
      flag=Time[0];
      deinit();
      double onetick;
      double Mediana=0;
      int MaxSize=0;
      int MySize=0;
      int MySizeEuropa=0;
      int MySizeAzia=0;
      int MySizeAmerica=0;
      int BACK=0;
      if (lastdayStart) StartDate=Time[0];

      int x=Period();
      if (x>60) return(-1);
      if (x<5) return(-1);

      BACK=0;
      while (TimeDayOfYear(Time[BACK])>TimeDayOfYear(StartDate) || TimeYear(Time[BACK])!=TimeYear(StartDate) && (BACK<Bars))
      {
         BACK++;
         if (BACK>=Bars) return(0);
      }//while

      onetick = 1/(MathPow(10,Digits));
      i=BACK;
      int cycles;

      for (cycles=CountProfile;cycles>0;cycles--)
      {
         signal=false;
         LastHigh=High[i];
         LastLow=Low[i];

         while (!signal)
         {
            //if (i+1==Bars) signal=true;
            if (High[i+1]>LastHigh) LastHigh=High[i+1];
            if (Low[i+1]<LastLow) LastLow=Low[i+1];
            MaxSize=0;
            MySize=0;

            if (TimeDay(Time[i])!=TimeDay(Time[i+1]))
            {
               signal=true;
               CurPos=LastLow;

               while (CurPos<=LastHigh)
               {
                  MySizeAzia=0;
                  MySizeEuropa=0;
                  MySizeAmerica=0;

                  for (j=i;j>=BACK;j--)
                  {
                     if ((High[j]>=CurPos) && (Low[j]<=CurPos))
                     {
                        MySize++;
                        if (TimeHour(Time[j])>=13)  MySizeAmerica++;
                        else if ((TimeHour(Time[j])>=8) && (TimeHour(Time[j])<13)) MySizeEuropa++;
                        else MySizeAzia++;

                     }//if  //

                     buffer1[i]=EMPTY_VALUE;
                     if  (TimeHour(Time[0])>2 && TimeHour(Time[0])<24)   buffer1[0]=Mediana;


                  }//for

                  if (MySizeAzia+MySizeEuropa+MySizeAmerica>MaxSize)
                  {
                     MaxSize=MySizeAzia+MySizeEuropa+MySizeAmerica;
                     Mediana=CurPos;
                  }
                  if (i-MySizeAzia>=0) // hmmmm this doesn't look right
                     if(ObjectFind(Obj_Prefix+"rec"+"Azia"+TimeToStr(Time[i],TIME_DATE)+CurPos) == -1 && MySizeAzia!=0)
                     {
                        ObjectCreate(Obj_Prefix+"rec"+"Azia"+TimeToStr(Time[i],TIME_DATE)+CurPos, OBJ_RECTANGLE, 0, Time[i], CurPos,Time[i-MySizeAzia],CurPos+onetick);
                        ObjectSet(Obj_Prefix+"rec"+"Azia"+TimeToStr(Time[i],TIME_DATE)+CurPos, OBJPROP_COLOR, Asia_Color);
                     }//if

                  // FYI, we are not inside the if (i-MySizeAzia>=0) anymore. Not sure if we need to be...
                  if(ObjectFind(Obj_Prefix+"rec"+"Europa"+TimeToStr(Time[i],TIME_DATE)+CurPos) == -1 && MySizeEuropa!=0)
                  {
                     ObjectCreate(Obj_Prefix+"rec"+"Europa"+TimeToStr(Time[i],TIME_DATE)+CurPos, OBJ_RECTANGLE, 0, Time[i-MySizeAzia], CurPos,Time[i-MySizeAzia-MySizeEuropa],CurPos+onetick);
                     ObjectSet(Obj_Prefix+"rec"+"Europa"+TimeToStr(Time[i],TIME_DATE)+CurPos, OBJPROP_COLOR, Europe_Color);
                  }//if

                  if(ObjectFind(Obj_Prefix+"rec"+"America"+TimeToStr(Time[i],TIME_DATE)+CurPos) == -1 && MySizeAmerica!=0)
                  {
                     ObjectCreate(Obj_Prefix+"rec"+"America"+TimeToStr(Time[i],TIME_DATE)+CurPos, OBJ_RECTANGLE, 0, Time[i-MySizeAzia-MySizeEuropa], CurPos,Time[i-MySizeAzia-MySizeEuropa-MySizeAmerica],CurPos+onetick);
                     ObjectSet(Obj_Prefix+"rec"+"America"+TimeToStr(Time[i],TIME_DATE)+CurPos, OBJPROP_COLOR, US_Color);
                  }//if

                  CurPos=CurPos+onetick;
               }//while
               BACK=i+1;
             //  ObjectCreate(Obj_Prefix+1+"mediana"+TimeToStr(Time[i],TIME_DATE), OBJ_TREND, 0, Time[cycles+5], Mediana,Time[cycles],Mediana);//+onetick
             //  ObjectSet(Obj_Prefix1+1+"mediana"+TimeToStr(Time[i],TIME_DATE), OBJPROP_STYLE, POC_LineStyle);
             //  ObjectSet(Obj_Prefix1+1+"mediana"+TimeToStr(Time[i],TIME_DATE), OBJPROP_COLOR,POC_Color);
             //  ObjectSet(Obj_Prefix1+1+"mediana"+TimeToStr(Time[i],TIME_DATE), OBJPROP_WIDTH,1);
             //  ObjectSet(Obj_Prefix1+1+"mediana"+TimeToStr(Time[i],TIME_DATE), OBJPROP_RAY,0);


            }//if

            i++;
            if (i>=Bars) return(0);

         } //while

      } //for

   } //if

   return(0);
}

//+------------------------------------------------------------------+
//| Delete only our objects                                          |
//+------------------------------------------------------------------+
int DeleteObjects()
{
   for (int i = ObjectsTotal() - 1; i >= 0; i--)
   {
       string label = ObjectName(i);
       if (StringSubstr(label, 0, StringLen(Obj_Prefix)) != Obj_Prefix)
           continue;
       ObjectDelete(label);
   }
   return(0);
}
//+------------------------------------------------------------------+
Comments