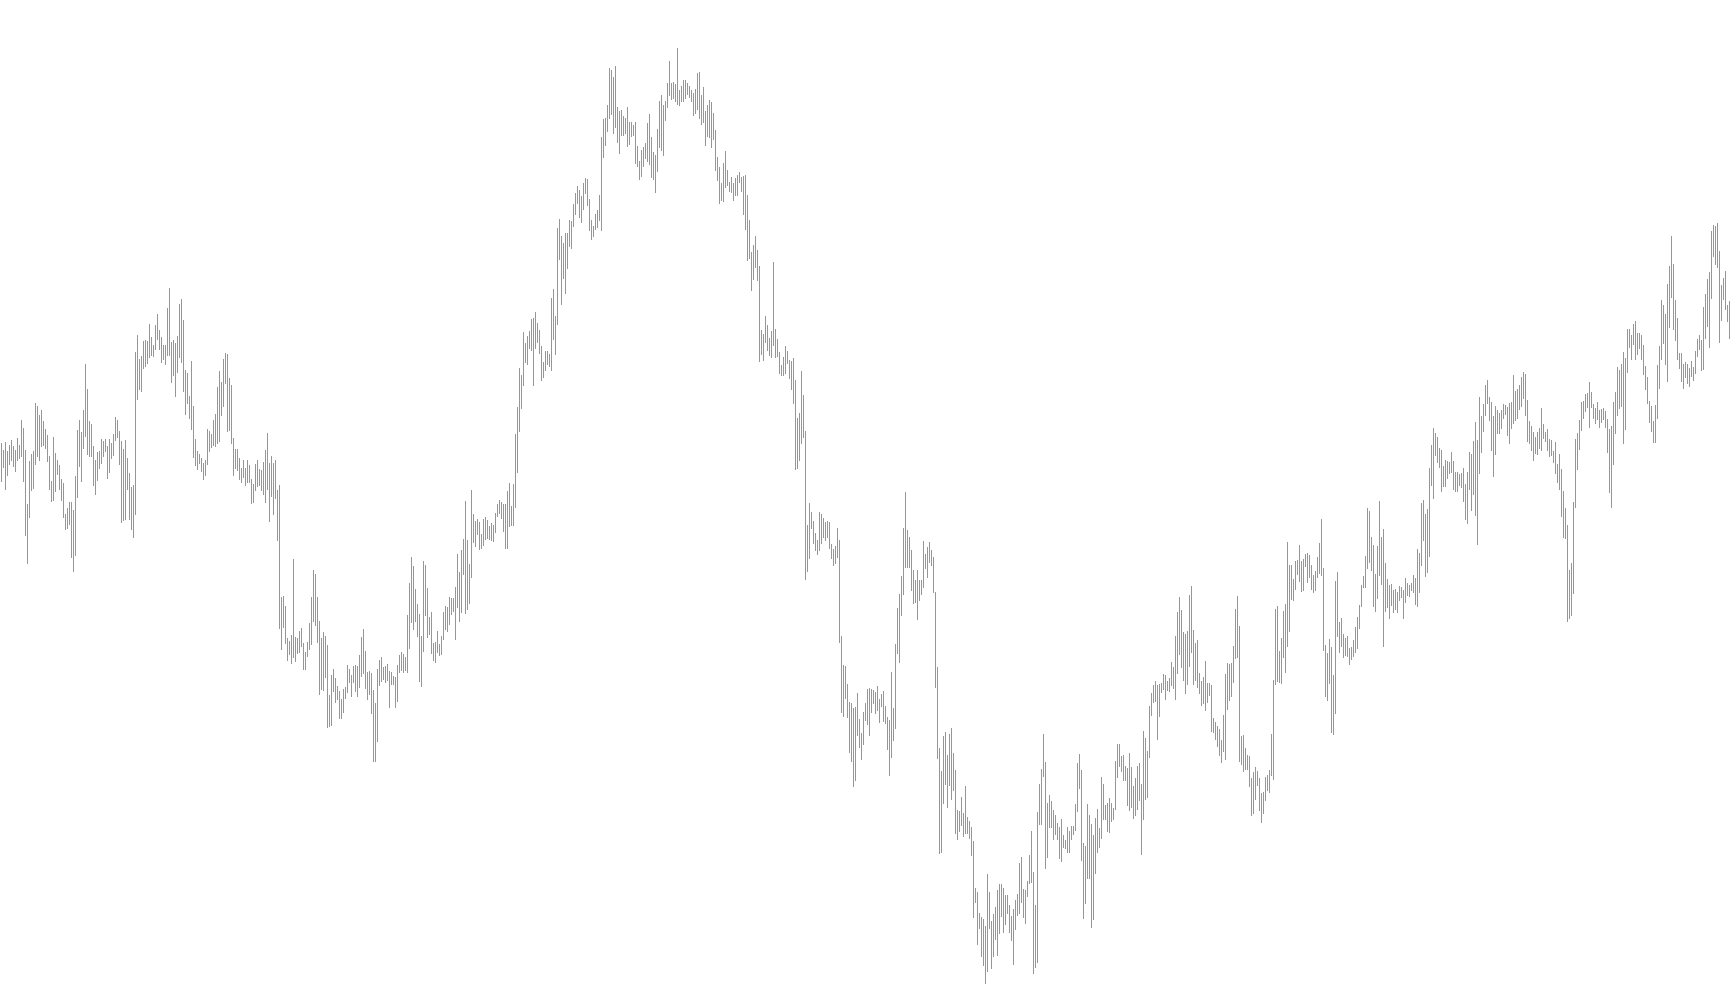
The #MTF SR. indicator is designed to provide traders with a multi-timeframe perspective on market structure by identifying significant support and resistance levels. Unlike standard indicators that only look at the current timeframe you are viewing, this tool "scans" multiple timeframes simultaneously to project historical price extremes onto your current chart.
Core Logic and Functionality
1. Multi-Timeframe Data Integration The primary logic of this script is its ability to pull data from different intervals (specifically 1-minute, 5-minute, 15-minute, and 30-minute periods) and display them all on a single chart. This allows you to see "the big picture" without having to constantly switch between different tabs or windows.
2. Fractal Identification The script utilizes a "Fractal" logic to determine key price points. In trading, a fractal represents a local peak (High) or valley (Low) in price action.
- Resistance Levels: The tool identifies high-point fractals across the chosen timeframes.
- Support Levels: The tool identifies low-point fractals across the chosen timeframes.
3. Dynamic Mapping and Continuity Because different timeframes have different numbers of bars, the script performs a sophisticated calculation to sync these various time periods with your current view. It creates "Time Arrays" to ensure that a resistance level from a 30-minute chart, for example, is correctly aligned with the specific price point on your 1-minute chart.
4. Visual Representation and Persistence The script handles the data in two distinct steps:
- Detection: It first scans the history to find every fractal point for each of the four timeframes.
- Filling: Since fractals are often "isolated" points, the script includes logic to "carry forward" these values. If a new fractal has not yet been formed on a higher timeframe, the indicator maintains the most recent known level on your screen. This ensures that support and resistance lines remain visible and relevant until a new price extreme is actually broken or formed.
User Experience Features
- Customizable Visibility: You can choose which specific timeframes to display or hide via the settings, allowing you to declutter your chart if you only care about certain intervals.
- Visual Cues: The indicator uses distinct arrow shapes and colors to differentiate between the various timeframe levels, making it easy to tell at a glance whether a level is a short-term (e.g., 1M) or longer-term (e.g., 30M) structural point.
- Audio Alerts: The script includes a functionality to trigger sounds, providing an audible cue when new data is processed or specific conditions are met.
/*-----------------------------+
|			       |
| Shared by www.Aptrafx.com    |
|			       |
+------------------------------*/

//+------------------------------------------------------------------+
//|                                                      #MTF SR.mq4 |
//|                                      Copyright © 2006, Eli hayun |
//|                                          http://www.elihayun.com |
//+------------------------------------------------------------------+
#property copyright "Copyright © 2006, Eli hayun"
#property link      "http://www.elihayun.com"

#property indicator_chart_window
#property indicator_buffers 8
#property indicator_color1 Red
#property indicator_color2 Blue
#property indicator_color3 Red
#property indicator_color4 Blue
#property indicator_color5 Red
#property indicator_color6 Blue
#property indicator_color7 Red
#property indicator_color8 Blue
//---- buffers
double buf_up1D[];
double buf_down1D[];

double buf_up4H[];
double buf_down4H[];

double buf_up1H[];
double buf_down1H[];

double buf_up30M[];
double buf_down30M[];

extern int Period_1 = PERIOD_M1;
extern int Period_2 = PERIOD_M5;
extern int Period_3 = PERIOD_M15;
extern int Period_4 = PERIOD_M30;


extern bool display_Period_1 = true;
extern bool display_Period_2 = true;
extern bool display_Period_3 = true;
extern bool display_Period_4 = true;

extern bool Play_Sound = true;

int UniqueNum = 2284;

//+------------------------------------------------------------------+
//| Custom indicator initialization function                         |
//+------------------------------------------------------------------+
int init()
  {
//---- indicators


   int draw = DRAW_LINE; if (!display_Period_4) draw = DRAW_NONE;
   SetIndexStyle(0,DRAW_ARROW);
   SetIndexArrow(0,169);
   SetIndexStyle(1,DRAW_ARROW);
   SetIndexArrow(1,169);

   SetIndexBuffer(0,buf_up1D);
   SetIndexBuffer(1,buf_up1D);
   SetIndexBuffer(1,buf_down1D);
   SetIndexLabel(0, tf2txt(Period_4)); SetIndexLabel(1, tf2txt(Period_4));

   draw = DRAW_LINE; if (!display_Period_3) draw = DRAW_NONE;
   SetIndexStyle(2,DRAW_ARROW);
   SetIndexArrow(2,170);
   SetIndexStyle(3,DRAW_ARROW);
   SetIndexArrow(3,170);

   SetIndexBuffer(2,buf_up4H);
   SetIndexBuffer(3,buf_down4H);
   SetIndexLabel(2, tf2txt(Period_3)); SetIndexLabel(3, tf2txt(Period_3));


   draw = DRAW_LINE; if (!display_Period_2) draw = DRAW_NONE;
   SetIndexStyle(4,DRAW_ARROW);
   SetIndexArrow(4,171);
   SetIndexStyle(5,DRAW_ARROW);
   SetIndexArrow(5,171);

   SetIndexBuffer(4,buf_up1H);
   SetIndexBuffer(5,buf_down1H);
   SetIndexLabel(4, tf2txt(Period_2)); SetIndexLabel(5, tf2txt(Period_2));

   draw = DRAW_LINE; if (!display_Period_1) draw = DRAW_NONE;
   SetIndexStyle(6,DRAW_ARROW);
   SetIndexArrow(6,172);
   SetIndexStyle(7,DRAW_ARROW);
   SetIndexArrow(7,172);

   SetIndexBuffer(6,buf_up30M);
   SetIndexBuffer(7,buf_down30M);
   SetIndexLabel(6, tf2txt(Period_1)); SetIndexLabel(7, tf2txt(Period_1));
//----
   return(0);
  }
//+------------------------------------------------------------------+
//| Custom indicator deinitialization function                       |
//+------------------------------------------------------------------+
int deinit()
  {
//----

//----
   return(0);
  }
//+------------------------------------------------------------------+
//| Custom indicator iteration function                              |
//+------------------------------------------------------------------+
int start()
  {
   int    counted_bars=IndicatorCounted();
   int i=0, y1d=0, y4h=0, y1h=0, y30m=0;
   int limit=Bars-counted_bars;

   double pd_1=0, pd_2=0, pd_3=0, pd_4=0;
   double pu_1=0, pu_2=0, pu_3=0, pu_4=0;

   datetime TimeArray_1D[] ,TimeArray_4H[], TimeArray_1H[], TimeArray_30M[];
//----
   ArrayCopySeries(TimeArray_1D,MODE_TIME,Symbol(),Period_4);
   ArrayCopySeries(TimeArray_4H,MODE_TIME,Symbol(),Period_3);
   ArrayCopySeries(TimeArray_1H,MODE_TIME,Symbol(),Period_2);
   ArrayCopySeries(TimeArray_30M,MODE_TIME,Symbol(),Period_1);

   for(i=0, y1d=0,  y4h=0,  y1h=0,  y30m=0;i<limit;i++)
   {
      if (Time[i]<TimeArray_1D[y1d]) y1d++;
      if (Time[i]<TimeArray_4H[y4h]) y4h++;
      if (Time[i]<TimeArray_1H[y1h]) y1h++;
      if (Time[i]<TimeArray_30M[y30m]) y30m++;

      double fh = iFractals( NULL, Period_4, MODE_HIGH, y1d);

      buf_up1D[i] = fh;
      buf_down1D[i] = iFractals( NULL, Period_4, MODE_LOW, y1d);

      buf_up4H[i] = iFractals( NULL, Period_3, MODE_HIGH, y4h);
      buf_down4H[i] = iFractals( NULL, Period_3, MODE_LOW, y4h);


      buf_up1H[i] = iFractals( NULL, Period_2, MODE_HIGH, y1h);
      buf_down1H[i] = iFractals( NULL, Period_2, MODE_LOW, y1h);


      buf_up30M[i] = iFractals( NULL, Period_1, MODE_HIGH, y30m);
      buf_down30M[i] = iFractals( NULL, Period_1, MODE_LOW, y30m);

   }

   for (i=limit; i>=0; i--)
   {
      if (   buf_up1D[i] == 0 )   buf_up1D[i] = pu_1; else  pu_1 = buf_up1D[i];
      if (   buf_down1D[i] == 0 ) buf_down1D[i] = pd_1; else  pd_1 = buf_down1D[i];

      if (   buf_up4H[i] == 0 )   buf_up4H[i] = pu_2; else  pu_2 = buf_up4H[i];
      if (   buf_down4H[i] == 0 ) buf_down4H[i] = pd_2; else  pd_2 = buf_down4H[i];

      if (   buf_up1H[i] == 0 )   buf_up1H[i] = pu_3; else  pu_3 = buf_up1H[i];
      if (   buf_down1H[i] == 0 ) buf_down1H[i] = pd_3; else  pd_3 = buf_down1H[i];

      if (   buf_up30M[i] == 0 )   buf_up30M[i] = pu_4; else  pu_4 = buf_up30M[i];
      if (   buf_down30M[i] == 0 ) buf_down30M[i] = pd_4; else  pd_4 = buf_down30M[i];
   }

//----
   return(0);
  }
//+------------------------------------------------------------------+


string tf2txt(int tf)
{
   if (tf == PERIOD_M1)    return("M1");
   if (tf == PERIOD_M5)    return("M5");
   if (tf == PERIOD_M15)    return("M15");
   if (tf == PERIOD_M30)    return("M30");
   if (tf == PERIOD_H1)    return("H1");
   if (tf == PERIOD_H4)    return("H4");
   if (tf == PERIOD_D1)    return("D1");
   if (tf == PERIOD_W1)    return("W1");
   if (tf == PERIOD_MN1)    return("MN1");

   return("??");
}
Comments