_255ePivot_PP
Download script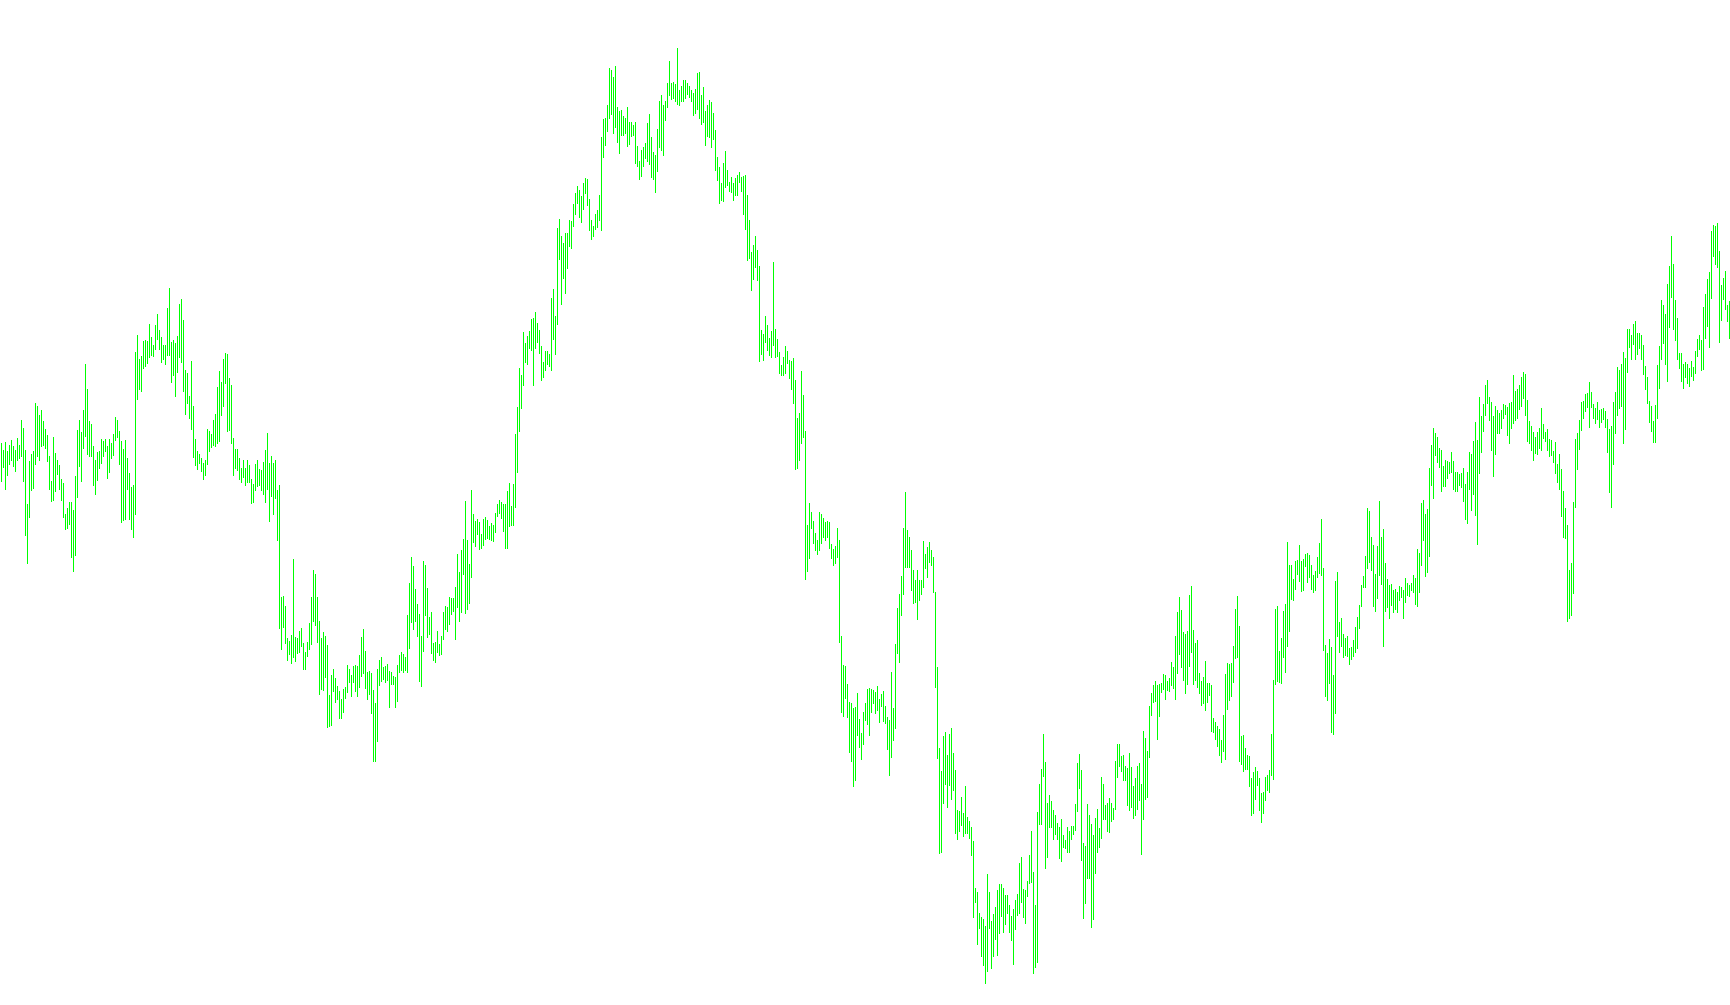
This script is designed for the MetaTrader platform to identify and visualize "Pivot Points" on a price chart. Specifically, it automates the calculation of key price levels based on the previous day's market activity, helping traders identify potential areas of support and resistance.
How the Logic Works
1. Detecting New Trading Days The script constantly monitors the timeline of the market. It includes a specific check to identify exactly when a new day begins (at midnight). This allows the tool to distinguish between price action from the current day and data gathered from the past.
2. Gathering Historical Data To calculate the Pivot Point, the script looks back at the completed trading session of the previous day. It automatically scans that period to find two critical pieces of information:
- The highest price reached (High).
- The lowest price reached (Low).
- The final closing price of that day.
3. Pivot Point Calculations Once it has gathered the high, low, and close prices from yesterday, the script uses a mathematical formula to determine the Pivot Point for today. The user can choose between two different calculation methods:
- Standard Method: A classic average involving the high, low, and previous close.
- Alternative Method: A weighted average that gives more importance to the previous day's closing price.
4. Visualizing the Data on the Chart Instead of just showing a single number, the script "draws" these levels onto your chart.
- Consistency: The script ensures that the Pivot Point remains constant throughout the current trading day. When a new day begins, it calculates the new level; for all other bars in between, it carries over the previous value so you can see a steady horizontal reference line.
- Timeframe Compatibility: The tool is designed to be most effective on smaller timeframes (like hourly charts), as it automatically restricts its operation if the user views a timeframe that is too large to provide meaningful daily data.
Summary for the Trader
Essentially, this tool acts as an automated "map maker." It looks at what happened yesterday, does the math to find the equilibrium point, and draws it on your screen today. This helps you visualize where the market might react or reverse based on historical price boundaries.
/*-----------------------------+
|			       |
| Shared by www.Aptrafx.com    |
|			       |
+------------------------------*/

//+------------------------------------------------------------------+
//|                                                    ^Pivot_PP.mq4 |
//|                                      Modest, Rosh conversed only |
//|                           http://forexsystems.ru/phpBB/index.php |
//+------------------------------------------------------------------+
#property copyright "Modest, Rosh conversed only"
#property link      "http://forexsystems.ru/phpBB/index.php"
//// Ñòðîèì Pivot è Res/Supp ïî FibonacciTrader Journal Issue 6
#property indicator_chart_window
#property indicator_buffers 1
#property indicator_color1 DarkGreen
//---- input parameters
extern int       Formula=0;
int i=1, shift;
double FP=0.0;
double FH=0.0, FL=0.0;
bool result;
//---- buffers
double ExtMapBuffer1[];

//+------------------------------------------------------------------+
//| Ïðîâåðêà íîâîãî äíÿ                                              |
//+------------------------------------------------------------------+
bool isNewDay(int _shift)
  {
//----
   result=false;
   if (  (TimeHour(Time[_shift])==0)  && (TimeMinute(Time[_shift])==0)   ) result=true;

//----
   return(result);
  }
//+------------------------------------------------------------------+
//| Ïîëó÷èòü óðîâåíü FP ïðîøåäøåãî äíÿ                               |
//+------------------------------------------------------------------+
double GetFPofDay(int _shift)
  {
  int prevDay=TimeDay(Time[_shift+1]);
//----
   i=1;
   while (TimeDay(Time[_shift+i])==prevDay) i++;
   i--;
   FH=High[Highest(NULL,0,MODE_HIGH,i,_shift+1)];
   FL=Low[Lowest(NULL,0,MODE_LOW,i,_shift+1)];
   if (Formula==0) FP=NormalizeDouble((FH+FL+Close[_shift+1])/3.0,Digits); else FP=NormalizeDouble((FH+FL+2*Close[_shift+1])/4.0,Digits);
//----
   return(FP);
  }
//+------------------------------------------------------------------+
//| Custom indicator initialization function                         |
//+------------------------------------------------------------------+
int init()
  {
   if (Formula!=0)Formula=1;
   string label="Pivot_PP("+Formula+")";
//---- indicators
   SetIndexStyle(0,DRAW_ARROW);
   SetIndexArrow(0,160);
   SetIndexBuffer(0,ExtMapBuffer1);
   SetIndexEmptyValue(0,0.0);
   SetIndexLabel(0,label);

//----
   return(0);
  }
//+------------------------------------------------------------------+
//| Custor indicator deinitialization function                       |
//+------------------------------------------------------------------+
int deinit()
  {
//----

//----
   return(0);
  }
//+------------------------------------------------------------------+
//| Custom indicator iteration function                              |
//+------------------------------------------------------------------+
int start()
  {
   int limit,firstDay;
   int counted_bars=IndicatorCounted();
   if (counted_bars<0) return(0);
   if (counted_bars==0)
      {
      limit=Bars-1;
      i=1;
      firstDay=TimeDay(Time[limit]);
      while (TimeDay(Time[limit-i])==firstDay) i++;
      limit=limit-i-PERIOD_D1/Period();
      }
   if (counted_bars>0) limit=Bars-counted_bars;
//----
   if (Period()>PERIOD_H4) return;
   for (shift=limit;shift>=0;shift--)
      {
      if (isNewDay(shift)) ExtMapBuffer1[shift]=GetFPofDay(shift); else  ExtMapBuffer1[shift]=ExtMapBuffer1[shift+1];
      //if (shift==0) SetNullBarValue(shift);
      }
//----
   return(0);
  }
//+------------------------------------------------------------------+
Comments