2MA_RSI
Download script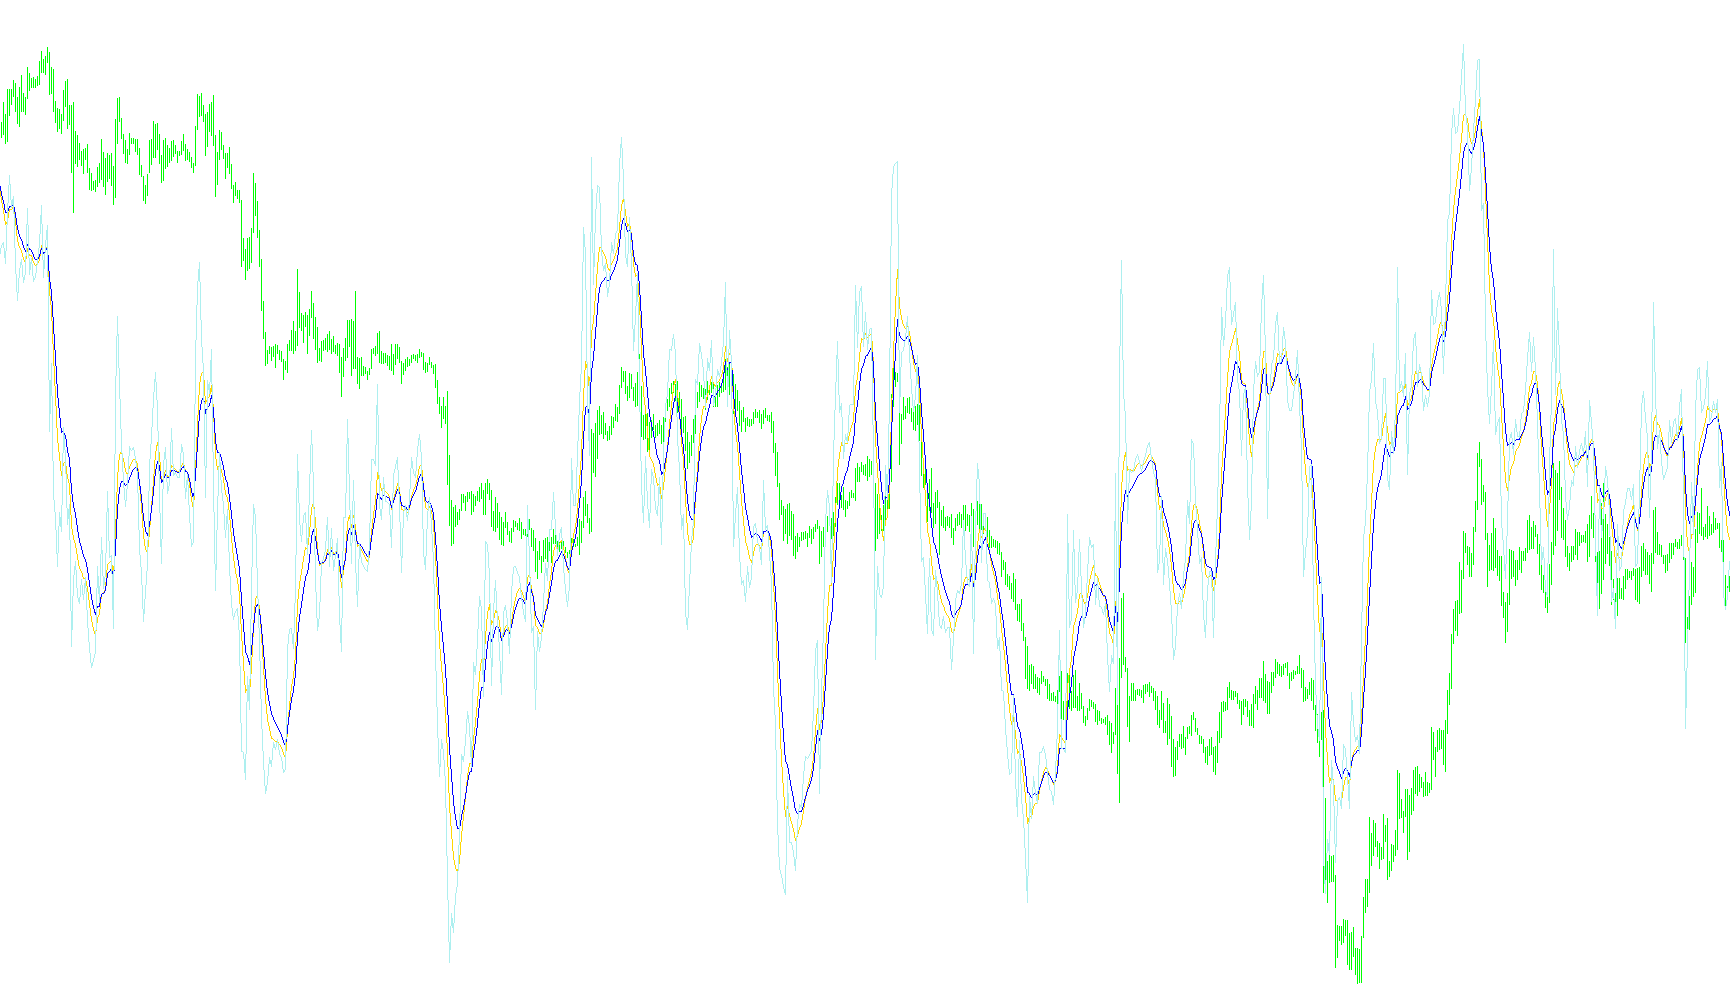
This tool is designed as a specialized visual aid for traders to analyze market momentum and identify potential price trends. It functions by layering three distinct layers of data into a single, easy-to-read window below your main price chart.
How the Logic Works
The script operates through a "nested" calculation process. Instead of looking at simple price movement, it creates a filtered view of the market's strength:
1. The Foundation (RSI) First, the tool calculates the Relative Strength Index (RSI). This is a standard momentum indicator that measures how fast and how far the price is moving in a specific direction. It provides the raw "heartbeat" of the market’s current strength.
2. The Smoothing Layer (Moving Averages) Rather than showing you the raw RSI—which can often be jagged and jump around erratically—the script applies two different Moving Averages (MA) directly onto the RSI data.
- It takes the "heartbeat" of the market and smooths it out to reveal the underlying trend.
- By using two different periods for these averages, the tool allows you to see both short-term fluctuations and slightly broader momentum shifts simultaneously.
Visual Representation
The script displays three unique lines on your screen:
- The RSI Line: The base momentum data.
- Moving Average 1: A fast-reacting smoothed trend line.
- Moving Average 2: A slower, more stable smoothed trend line.
Summary for the Trader
The primary purpose of this logic is to filter out "noise." By applying moving averages to an RSI indicator, the tool helps you identify when momentum is genuinely shifting direction versus when it is just experiencing a minor temporary spike. When these lines cross or diverge, they provide a visual signal regarding whether the market strength is accelerating, slowing down, or reversing.
//+------------------------------------------------------------------+
//|                                                      2MA_RSI.mq4 |
//|                                                                  |
//|                                                                  |
//+------------------------------------------------------------------+
#property copyright ""
#property link ""

#property indicator_separate_window
//#property indicator_minimum 0
//#property indicator_maximum 100
//#property indicator_level1  20
//#property indicator_level2  80
#property indicator_buffers 3
#property indicator_color1 Yellow
#property indicator_color2 Aqua
#property indicator_color3 MediumOrchid

extern int  RSI_Timeframe=0;//0=current chart,1=m1,5=m5,15=m15,30=m30,60=h1,240=h4,etc...
extern int  RSI_Period = 14;
extern int  RSI_Applied_Price = 0;//0=close, 1=open, 2=high, 3=low, 4=(high+low)/2, 5=(high+low+close)/3, 6=(high+low+close+close)/4
extern int  MA1_Period = 7;
extern int  MA1_Method = 1;// 0=SMA, 1=EMA, 2=SMMA, 3=LWMA
extern int  MA2_Period = 11;
extern int  MA2_Method = 1;// 0=SMA, 1=EMA, 2=SMMA, 3=LWMA

double MA1_Array[],MA2_Array[],RSI[];

//+------------------------------------------------------------------+
//| Custom indicator initialization function |
//+------------------------------------------------------------------+
int init()
{
//---- indicators setting
SetIndexStyle(0,DRAW_LINE,STYLE_SOLID,1);
SetIndexStyle(1,DRAW_LINE,STYLE_SOLID,1);
SetIndexStyle(2,DRAW_LINE,STYLE_SOLID,1);

IndicatorDigits(MarketInfo(Symbol(),MODE_DIGITS));
IndicatorShortName("2MA of RSI "+RSI_Timeframe);

SetIndexBuffer(0,MA1_Array);
SetIndexLabel(0,"MA1-RSI "+MA1_Period);

SetIndexBuffer(1,MA2_Array);
SetIndexLabel(1,"MA2-RSI "+MA2_Period);

SetIndexBuffer(2,RSI);
SetIndexLabel(2,"RSI "+RSI_Period);

return(0);
}

//+------------------------------------------------------------------+
//| Custom indicator iteration function |
//+------------------------------------------------------------------+
int start()
{
int limit = Bars - IndicatorCounted() - 1;

//---- indicator calculation

   for(int i=limit; i>=0; i--)
   {
    RSI[i]= iRSI(NULL,RSI_Timeframe,RSI_Period,RSI_Applied_Price,i);
   }

   for(i=limit; i>=0; i--)
   {
    MA1_Array[i] = iMAOnArray(RSI,0,MA1_Period,0,MA1_Method,i);
    MA2_Array[i] = iMAOnArray(RSI,0,MA2_Period,0,MA2_Method,i);
   }
//----
return(0);
}
//+------------------------------------------------------------------+
Comments