2rsi-01
Download script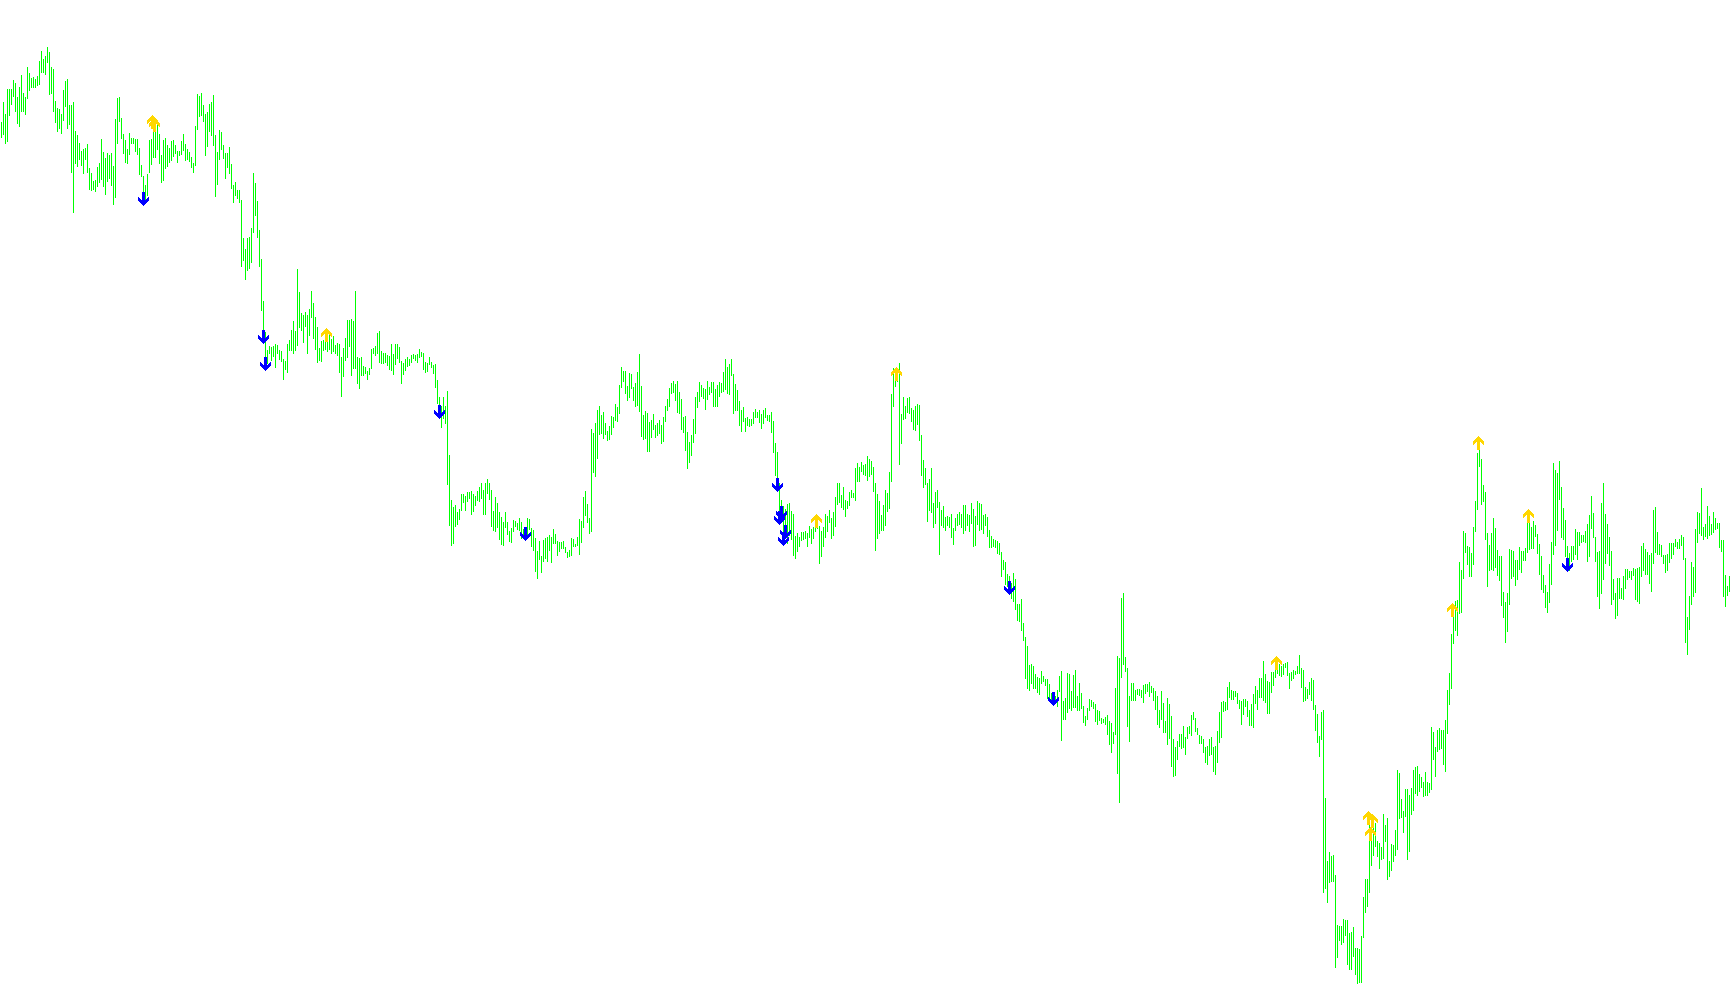
This tool is designed as a visual aid for traders who monitor the market on shorter timeframes, specifically aimed at identifying momentum shifts. It functions by analyzing the Relative Strength Index (RSI)—a standard technical indicator that measures the speed and change of price movements—to detect specific trends in the market's behavior.
How it Works
The script continuously scans historical price data to look for "streaks" in the RSI values. Rather than just looking at a single moment in time, it evaluates a sequence of eight consecutive data points to ensure that a trend is consistent and not just a minor fluctuation.
- Identifying Upward Momentum: The tool looks for instances where the RSI value is steadily increasing over five consecutive steps. When it detects this sustained rise, it places an Up Arrow on the chart at the highest point of that price candle, signaling strong bullish momentum.
- Identifying Downward Momentum: Conversely, the tool scans for instances where the RSI value is steadily decreasing over five consecutive steps. When this continuous drop is confirmed, it places a Down Arrow at the lowest point of the candle, signaling strong bearish momentum.
Key Features for Traders
- Trend Confirmation: By requiring a sequence of five consecutive movements (rather than just one), the logic helps filter out "market noise," aiming to highlight more reliable trend shifts.
- Visual Clarity: The script automatically plots these signals directly on your main chart window, allowing you to see potential entry or exit points instantly without having to manually interpret complex RSI waves.
- Historical Analysis: The tool processes a significant amount of historical data (starting from 100 bars back) so that you can see how the momentum behaved in past sessions, helping you gauge the reliability of the signals in different market conditions.
Indicators Used
Miscellaneous
12
Views
0
Downloads
0
Favorites
2rsi-01
//+------------------------------------------------------------------+
//| 10 Minute trader                                                 |
//+------------------------------------------------------------------+
#property copyright "Ron T"
#property link      "http://www.lightpatch.com"

#property indicator_chart_window
#property indicator_buffers 5
#property indicator_color1 White
#property indicator_color2 Red
#property indicator_color3 Aqua
#property indicator_color4 Blue
#property indicator_color5 LimeGreen

//---- buffers
double ExtMapBuffer1[];
double ExtMapBuffer2[];
double ExtMapBuffer3[];
double ExtMapBuffer4[];
double ExtMapBuffer5[];


// User Input


//+------------------------------------------------------------------+
//| Custom indicator initialization function                         |
//|------------------------------------------------------------------|

int init()
  {

   // 233 up arrow
   // 234 down arrow
   // 159 big dot
   // 168 open square

   SetIndexStyle(0,DRAW_ARROW);
   SetIndexBuffer(0, ExtMapBuffer1);
   SetIndexArrow(0,233);  //up

   SetIndexStyle(1,DRAW_ARROW);
   SetIndexBuffer(1, ExtMapBuffer2);
   SetIndexArrow(1,234);  //down

   SetIndexStyle(2,DRAW_ARROW);
   SetIndexBuffer(2, ExtMapBuffer3);
   SetIndexArrow(2,168);

   SetIndexStyle(3,DRAW_ARROW);
   SetIndexBuffer(3, ExtMapBuffer4);
   SetIndexArrow(3,168);

   SetIndexStyle(4,DRAW_ARROW);
   SetIndexBuffer(4, ExtMapBuffer5);
   SetIndexArrow(4,168);  //open square

   return(0);
  }


//+------------------------------------------------------------------+
//| Custor indicator deinitialization function                       |
//+------------------------------------------------------------------+
int deinit()
  {
   int i;

   for( i=0; i<Bars; i++ ) ExtMapBuffer1[i]=0;
   for( i=0; i<Bars; i++ ) ExtMapBuffer2[i]=0;
   for( i=0; i<Bars; i++ ) ExtMapBuffer3[i]=0;
   for( i=0; i<Bars; i++ ) ExtMapBuffer4[i]=0;
   for( i=0; i<Bars; i++ ) ExtMapBuffer5[i]=0;

   return(0);
  }


//+------------------------------------------------------------------+
//| Custom indicator iteration function                              |
//+------------------------------------------------------------------+
int start()
  {
   double   rsi0=0;
   double   rsi1=0;
   double   rsi2=0;
   double   rsi3=0;
   double   rsi4=0;
   double   rsi5=0;
   double   rsi6=0;
   double   rsi7=0;

   int pos=Bars-100;             // leave room for moving average periods

   while(pos>=0)
     {
      rsi0=iRSI(Symbol(),0,28,PRICE_CLOSE,pos+0);
      rsi1=iRSI(Symbol(),0,28,PRICE_CLOSE,pos+1);
      rsi2=iRSI(Symbol(),0,28,PRICE_CLOSE,pos+2);
      rsi3=iRSI(Symbol(),0,28,PRICE_CLOSE,pos+3);
      rsi4=iRSI(Symbol(),0,28,PRICE_CLOSE,pos+4);
      rsi5=iRSI(Symbol(),0,28,PRICE_CLOSE,pos+5);
      rsi6=iRSI(Symbol(),0,28,PRICE_CLOSE,pos+6);
      rsi7=iRSI(Symbol(),0,28,PRICE_CLOSE,pos+7);


      if (rsi0>rsi1 && rsi1>rsi2 && rsi2>rsi3 && rsi3>rsi4 && rsi4>rsi5)
        {
         ExtMapBuffer1[pos]=High[pos];
        }

      if (rsi0<rsi1 && rsi1<rsi2 && rsi2<rsi3 && rsi3<rsi4 && rsi4<rsi5)
        {
         ExtMapBuffer2[pos]=Low[pos];
        }

 	   pos--;
     }

   return(0);
  }
//+------------------------------------------------------------------+
Comments