3c_Turbo_JRSX_wAppliedPrice
Download script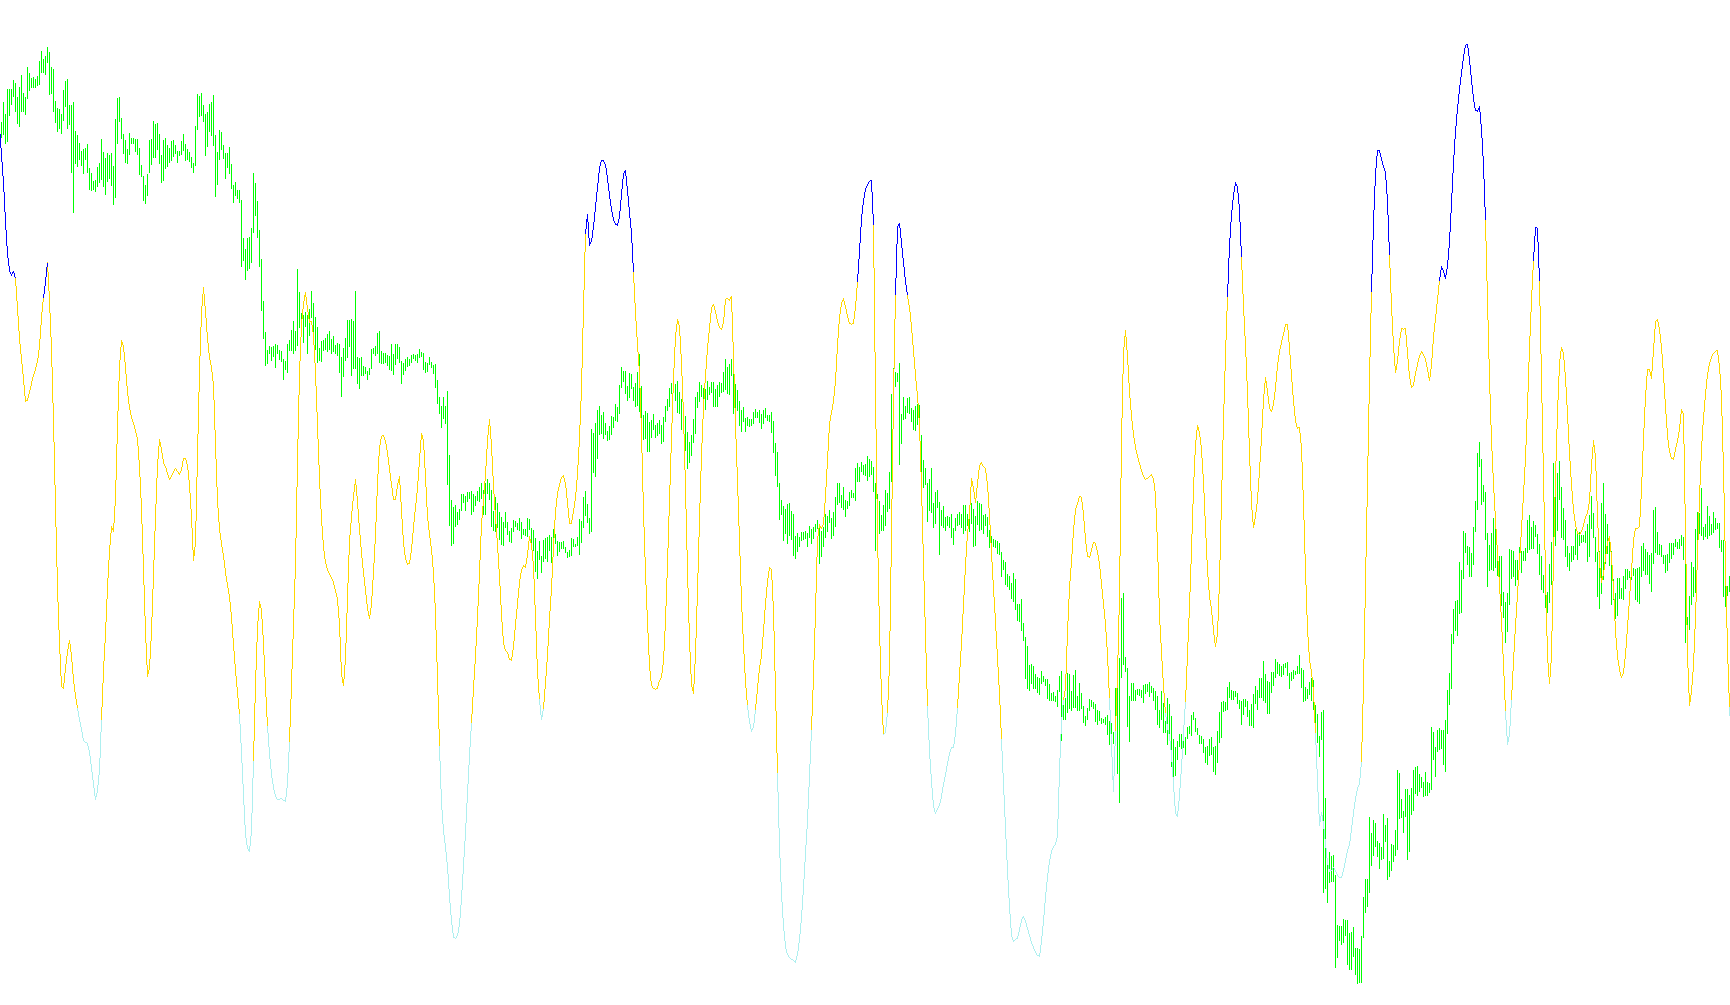
This script is designed as a technical analysis indicator for the MetaTrader platform, specifically created to visualize and track price momentum and volatility. It provides a visual representation of market sentiment by calculating specific price movements over a defined period.
Core Functionality
The primary purpose of this tool is to transform raw market data into a readable numerical value (ranging from 0 to 100). This allows traders to see the "strength" of a trend relative to a baseline, rather than just looking at the price fluctuations alone.
Key Logic Components
1. Customizable Price Selection One of the core features of this script is its flexibility in data sourcing. Instead of being locked into one type of price movement, the user can choose which "source" the indicator should use to calculate its values. The available options include:
- Closing Price: The final price at the end of a candle.
- Opening/High/Low Prices: Specific boundaries of the price action.
- Median Price: The midpoint between the high and low.
- Typical Price: The average of the high, low, and close.
- Weighted Price: A calculation that gives more significance to the closing price.
2. Momentum and Smoothing Calculations The script performs a series of complex mathematical operations to "smooth" out the noise of the market. It calculates the difference between current prices and past prices, then applies multiple layers of weighted averages. This process helps in identifying whether a trend is accelerating, decelerating, or remaining steady.
3. Dynamic Scaling (0-100 Range) The logic converts these complex calculations into a percentage-based scale. By normalizing the data between 0 and 100, it creates a standardized view where:
- The Center (50) represents the neutral equilibrium.
- Movement toward 100 indicates significant upward momentum.
- Movement toward 0 indicates significant downward momentum.
4. Visual Signal Thresholds To make the indicator more actionable for a human user, the script incorporates "Levels." It monitors when the calculated value crosses specific boundaries (such as 70 and 30). When these thresholds are breached, it triggers visual changes on the chart—effectively highlighting extreme overbought or oversold conditions to help the trader identify potential trend reversals or exhaustion points.
Summary of Use
Essentially, this script acts as a "speedometer" for the market. By selecting your preferred price type and observing the resulting line on the 0-100 scale, you can determine not just which direction the market is moving, but how much energy and momentum are behind that movement.
//+---------------------------------------------------------+
//|                       3c_Turbo_JRSX_wAppliedPrice.mq4   |
//|modified to make price mode selectable by user - bluto   |
//|                      Color addition c 2008 codobro      |
//+---------------------------------------------------------+

#property copyright "strategybuilderfx.com - modified by bluto to use typical price (HLC/3), modifcations c 2008 codobro"
#property link "finger"
#property indicator_separate_window
#property indicator_buffers 3
#property indicator_color1 Gray
#property indicator_color2 Red
#property indicator_color3 Green
#property indicator_width1 2
#property indicator_width2 2
#property indicator_width3 2
#property indicator_level1 70
#property indicator_level2 30
#property indicator_level3 50
#property indicator_maximum 100
#property indicator_minimum 0

//---- input parameters
extern int Len=14; //---- buffers
extern double UpperLevel   =  70;
extern double LowerLevel   =  30;
extern string  p = "--Applied Price Types--";
extern string  p0 = " 0 = close";
extern string  p1 = " 1 = open";
extern string  p2 = " 2 = high";
extern string  p3 = " 3 = low";
extern string  p4 = " 4 = median(high+low)/2";
extern string  p5 = " 5 = typical(high+low+close)/3";
extern string  p6 = " 6 = weighted(high+low+close+close)/4";
extern int     PriceMode = 5;

double rsx[];
double jrhi[];
double jrlo[];

int init() {
   IndicatorShortName("3c_Turbo_JRSX");
   SetIndexStyle(0,DRAW_LINE);
   SetIndexBuffer(0,rsx);
   SetIndexStyle(1,DRAW_LINE);
   SetIndexBuffer(1,jrhi);
   SetIndexStyle(2,DRAW_LINE);
   SetIndexBuffer(2,jrlo);
   return(0);
}

int deinit()
{
   return(0);
}

int start()
{

   double tempPrice;
   double f88, f90;
   double f0, v4, v8, vC, v10, v14, v18, v20;
   double f8, f10, f18, f20, f28, f30, f38, f48, v1C;
   double f50, f58, f60, f68, f70, f78, f80, f40;

   //int counted_bars = IndicatorCounted(),limit,shift;

   //if (counted_bars<0) return(-1);
   //if (counted_bars>0) counted_bars--;
   double limit=Bars-(Len)-1;

   //if(counted_bars>Len) limit=Bars-counted_bars-1;

   for (int shift=limit;shift>=0;shift--) {
      tempPrice = GetPrice(PriceMode, shift);  // Get the price based on mode entered
      if (f90 == 0.0) {

         f90 = 1.0;
         f0 = 0.0;
         if (Len-1 >= 5) f88 = Len-1.0; else f88 = 5.0;
 //      f8 = 100.0*(Close[shift]);
 //
 //      Modified for median price
 //      Modified for any price based on PriceMode input
 //      default input is typical price
 //
 //        f8 = 100.0*((High[shift]+Low[shift]+Close[shift])/3);
         f8 = 100.0 * tempPrice;
         f18 = 3.0 / (Len + 2.0);
         f20 = 1.0 - f18;

      } else{
         if (f88 <= f90) f90 = f88 + 1; else f90 = f90 + 1;
         f10 = f8;
 //      f8 = 100*Close[shift];
 //         f8 = 100.0*((High[shift]+Low[shift]+Close[shift])/3);
         f8 = 100 * tempPrice;
         v8 = f8 - f10;
         f28 = f20 * f28 + f18 * v8;
         f30 = f18 * f28 + f20 * f30;
         vC = f28 * 1.5 - f30 * 0.5;
         f38 = f20 * f38 + f18 * vC;
         f40 = f18 * f38 + f20 * f40;
         v10 = f38 * 1.5 - f40 * 0.5;
         f48 = f20 * f48 + f18 * v10;
         f50 = f18 * f48 + f20 * f50;
         v14 = f48 * 1.5 - f50 * 0.5;
         f58 = f20 * f58 + f18 * MathAbs(v8);
         f60 = f18 * f58 + f20 * f60;
         v18 = f58 * 1.5 - f60 * 0.5;
         f68 = f20 * f68 + f18 * v18;

         f70 = f18 * f68 + f20 * f70;
         v1C = f68 * 1.5 - f70 * 0.5;
         f78 = f20 * f78 + f18 * v1C;
         f80 = f18 * f78 + f20 * f80;
         v20 = f78 * 1.5 - f80 * 0.5;

         if ((f88 >= f90) && (f8 != f10)) f0 = 1.0;
         if ((f88 == f90) && (f0 == 0.0)) f90 = 0.0;
      }

      if ((f88 < f90) && (v20 > 0.0000000001)) {

         v4 = (v14 / v20 + 1.0) * 50.0;
         if (v4 > 100.0) v4 = 100.0;
         if (v4 < 0.0) v4 = 0.0;

      } else {
         v4 = 50.0;
      }

      rsx[shift]=v4;
      jrhi[shift]=v4;
      jrlo[shift]=v4;

      if (v4 >= UpperLevel)
      {
          jrlo[shift] = EMPTY_VALUE;
      }
      else if (v4 <= LowerLevel)
      {
          jrhi[shift] = EMPTY_VALUE;
      }
      else
      {

         jrhi[shift]=EMPTY_VALUE;//EMPTY_VALUE;
         jrlo[shift]=EMPTY_VALUE;//EMPTY_VALUE;
      }


   }

   return(0);

}

// Applied Price enumerations
// 0=close, 1=open, 2=high, 3=low, 4=median((h+l/2)), 5=typical((h+l+c)/3), 6=weighted((h+l+c+c)/4)
double GetPrice(int pMode, int mShift)
{
   double price;

   switch(pMode)
   {
     case 0: price = Close[mShift];
             break;
     case 1: price = Open[mShift];
             break;
     case 2: price = High[mShift];
             break;
     case 3: price = Low[mShift];
             break;
     case 4: price = (High[mShift] + Low[mShift])/2.0;
             break;
     case 5: price = (High[mShift] + Low[mShift] + Close[mShift])/3.0;
             break;
     case 6: price = (High[mShift] + Low[mShift] + 2.0*Close[mShift])/4;
             break;
   }
   return (price);
}
Comments