3D_Oscilator_v1
Download script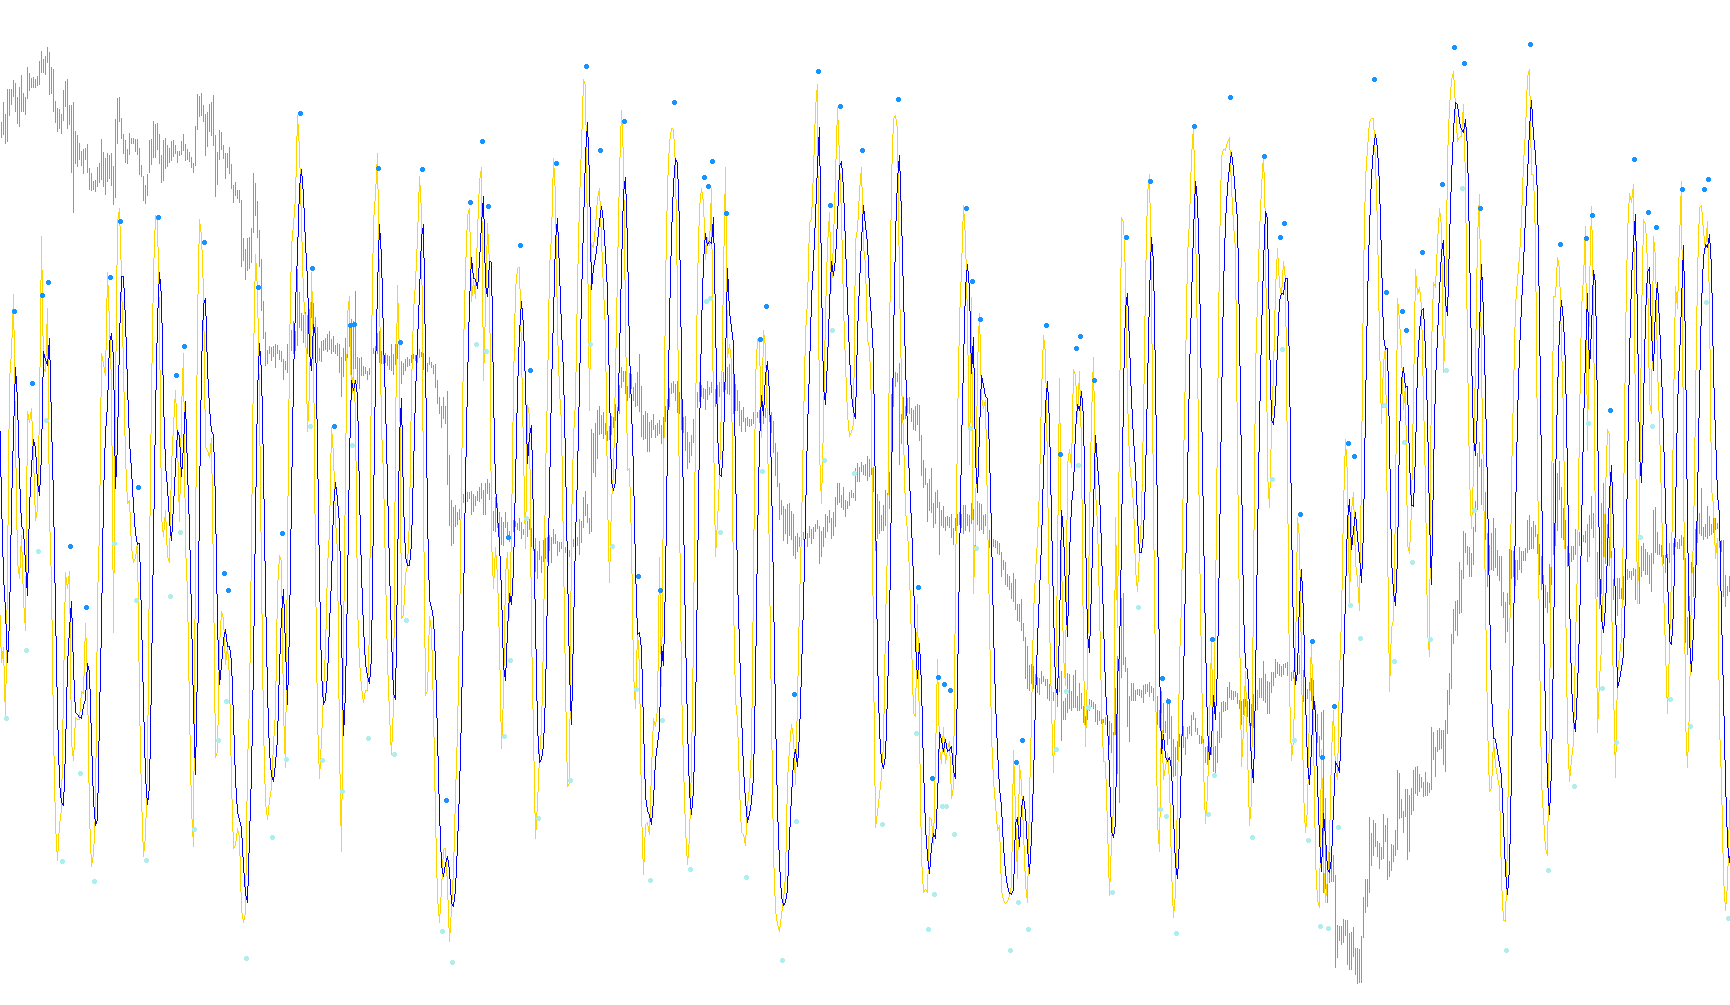
The 3D Oscillator is a sophisticated technical analysis tool designed to provide traders with a clearer picture of market momentum by combining multiple mathematical perspectives into a single visual display. Rather than relying on a single price movement, this script synthesizes three distinct layers of data to identify trends and potential reversals.
Core Logic and Components
The indicator operates by blending the following three elements:
- Relative Strength Index (RSI): It captures the velocity and change of price movements. The script looks at the RSI over a specific period to determine if an asset is overbought or oversold.
- Stochastic Movement: To refine the RSI data, the script calculates the position of the current RSI value relative to its highest and lowest points over a set timeframe. This helps identify where the price is currently sitting within its recent "range."
- Commodity Channel Index (CCI): This adds a third dimension by measuring how far the current price deviates from its statistical average.
How it Works Together
The script doesn't just show these three values side-by-side; it blends them mathematically using a "hot" parameter. This weight determines the balance between the CCI and the processed Stochastic/RSI data. By merging these, the indicator creates a "3D" effect—essentially viewing the market from multiple angles (momentum, range, and deviation) simultaneously.
Visual Signals for Traders
To make the data actionable for the user, the script produces two primary visual outputs:
- Trend Lines: The tool generates smoothed lines that represent the combined mathematical calculations. These lines help traders see the "flow" of the market momentum more clearly than raw price action alone.
- Automatic Signal Arrows: The logic is programmed to detect specific "crosses." When the primary moving calculation intersects with the secondary one in a significant way, the script automatically places an arrow on the chart.
- These arrows serve as visual cues for potential trend shifts, highlighting moments where momentum may be switching from upward to downward, or vice versa.
Summary of Experience
For a trader, this script acts as a filter. It takes noisy market data and boils it down into a smoothed visualization that highlights where the trend is strongest and provides clear markers (arrows) when the underlying momentum shifts, helping to identify potential entry and exit points with greater clarity.
/*-----------------------------+
|			       |
| Shared by www.Aptrafx.com    |
|			       |
+------------------------------*/

//+------------------------------------------------------------------+
//|                                                 3D Oscilator.mq4 |
//|                                                                  |
//|                                                                  |
//+------------------------------------------------------------------+
#property copyright "Author - Luis Damiani. Ramdass - Conversion only"

#property indicator_separate_window
#property indicator_buffers 4
#property indicator_color1 Magenta
#property indicator_color2 DarkSlateBlue
#property indicator_color3 GreenYellow
#property indicator_color4 Red
//---- input parameters

extern int D1RSIPer=13;
extern int D2StochPer=8;
extern int D3tunnelPer=8;
extern double hot=0.4;
extern int sigsmooth=4;


//---- buffers
double sig1n[];
double sig2n[];
double upX[],dnX[];

//+------------------------------------------------------------------+
//| Custom indicator initialization function                         |
//+------------------------------------------------------------------+
int init()
  {
   string short_name;
//---- indicator line
   SetIndexStyle(0,DRAW_LINE);
   SetIndexStyle(1,DRAW_LINE);
   SetIndexBuffer(0,sig1n);
   SetIndexBuffer(1,sig2n);

   SetIndexStyle(2,DRAW_ARROW);
   SetIndexArrow(2,159);
   SetIndexBuffer(2,upX);
   SetIndexStyle(3,DRAW_ARROW);
   SetIndexArrow(3,159);
   SetIndexBuffer(3,dnX);
//----
   SetIndexDrawBegin(0,D1RSIPer+D2StochPer+D3tunnelPer+hot+sigsmooth);
   SetIndexDrawBegin(1,D1RSIPer+D2StochPer+D3tunnelPer+hot+sigsmooth);
   SetIndexDrawBegin(2,D1RSIPer+D2StochPer+D3tunnelPer+hot+sigsmooth);
   SetIndexDrawBegin(3,D1RSIPer+D2StochPer+D3tunnelPer+hot+sigsmooth);

//----
   return(0);
  }
//+------------------------------------------------------------------+
//| CCI_Woodies                                                         |
//+------------------------------------------------------------------+
int start()
  {
   int i,i2,counted_bars=IndicatorCounted();
   double rsi,maxrsi,minrsi,storsi,E3D,
   sig1,sig2,sk,ss,sk2;
   double cs;
   bool init=true;

   //----
   cs= D1RSIPer+D2StochPer+D3tunnelPer+hot+sigsmooth;
   if(Bars<=cs) return(0);

   //if (init)
   //{
   ss=sigsmooth;
   if (ss<2) ss=2;
   sk = 2 / (ss + 1);
   sk2=2/(ss*0.8+1);
   init=false;
   //};

   //---- initial zero
   if(counted_bars<1)
      {
      for(i=1;i<=cs;i++) sig1n[Bars-i]=0.0;
      for(i=1;i<=cs;i++) sig2n[Bars-i]=0.0;
      for(i=1;i<=cs;i++) upX[Bars-i]=0.0;
      for(i=1;i<=cs;i++) dnX[Bars-i]=0.0;
      }

   i=Bars-cs-1;

   if (counted_bars>=cs) i=300; //i=Bars-counted_bars-1;
   while (i>=0)
      {

      rsi=iRSI(NULL,0,D1RSIPer,PRICE_CLOSE,i);
      maxrsi=rsi;
      minrsi=rsi;

      for (i2=i+D2StochPer;i2>=i; i2--)
         {
         rsi=iRSI(NULL,0,D1RSIPer,PRICE_CLOSE,i2);
         if (rsi>maxrsi) maxrsi=rsi;
         if (rsi<minrsi) minrsi=rsi;
         //maxrsi=Maximum(rsi,maxrsi);
         //minrsi=min(rsi,minrsi);
         }

      storsi=((rsi-minrsi)/(maxrsi-minrsi)*200-100);
      E3D=hot*iCCI(NULL,0,D3tunnelPer,PRICE_TYPICAL,i)+(1-hot)*storsi;
      sig1n[i]=sk*E3D+(1-sk)*sig1;
      sig2n[i]=sk2*sig1+(1-sk2)*sig2;
      sig1=sig1n[i];
      sig2=sig2n[i];

      if (sig1n[i]>sig2n[i] && sig1n[i+1]<sig2n[i+1]) upX[i]=sig2n[i]-15;
      if (sig1n[i]<sig2n[i] && sig1n[i+1]>sig2n[i+1]) dnX[i]=sig2n[i]+15;

      i--;
      }

   return(0);
   }
//+------------------------------------------------------------------+
Comments