3MA03IND_v1
Download script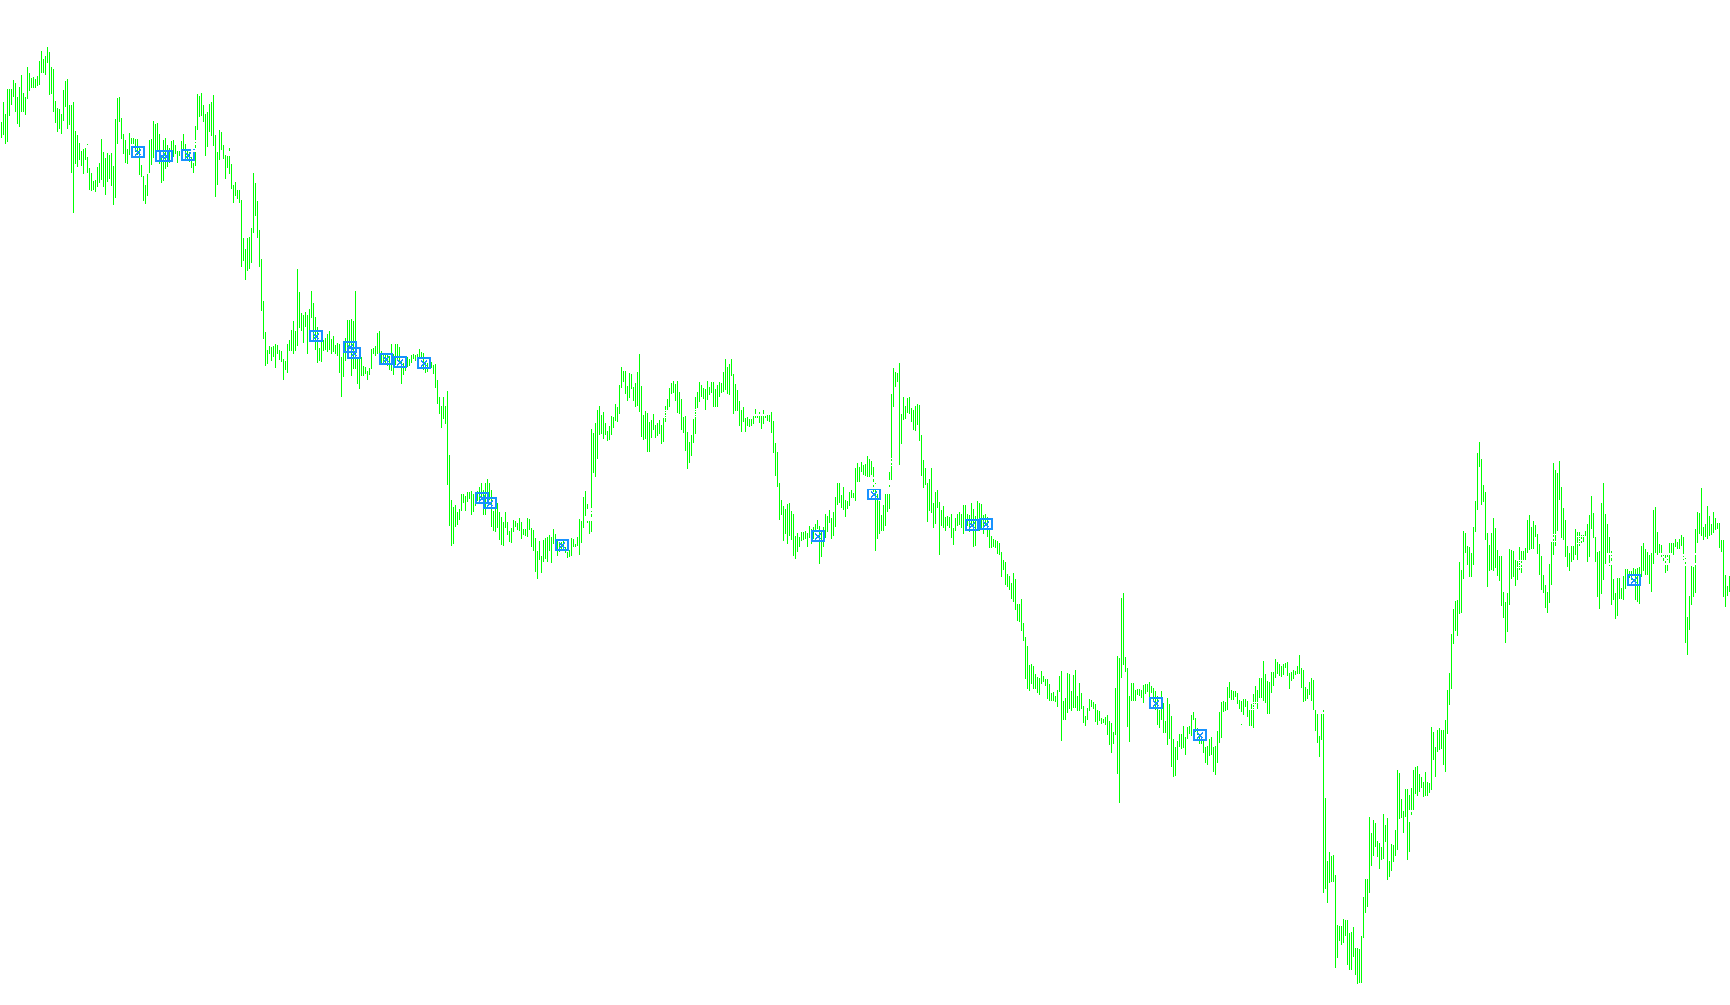
This custom technical indicator is designed to assist traders by identifying specific price momentum shifts and potential trend reversals directly on the chart. Rather than providing a single continuous line, it uses a system of visual markers (such as arrows and dots) to highlight key moments where moving averages interact in specific ways.
Core Logic and Mechanics
The tool operates by analyzing three different types of Linear Weighted Moving Averages (LWMA) simultaneously. These averages are calculated based on the closing prices of the assets over different timeframes: 5 periods, 25 periods, and 100 periods.
By comparing these three layers, the script identifies the following market conditions:
1. Bullish Momentum Signals (Buy Interest) The script monitors for a "crossover" where the short-term average (5-period) moves from below to above the medium-term average (25-period). For this signal to be validated by the logic, the long-term average (100-period) must also be positioned below the 25-period average. This suggests that while the long-term trend may be neutral or declining, a new short-term upward move is gaining strength.
2. Bearish Momentum Signals (Sell Interest) Conversely, the script looks for moments where the short-term average (5-period) crosses from above to below the medium-term average (25-period). To validate this as a sell signal, the long-term average (100-period) must be positioned above the 25-period average. This identifies a shift toward downward momentum in the immediate price action.
3. Take-Profit and Trend Exhaustion Markers The indicator also includes logic to identify potential "exhaustion" points or target zones. It looks for instances where the long-term moving average (100-period) intersects with the medium-term moving average (25-period). These points are flagged to help traders visualize areas where a trend might be losing steam or where a price correction might occur, potentially serving as markers for securing profits.
Visual Presentation
The script translates these mathematical calculations into on-chart symbols:
- Arrows/Dots: These appear at the specific candles where the conditions for momentum shifts are met, allowing the trader to see historical "triggers" at a glance.
- Automated Filtering: By requiring the 100-period average to be in a specific position relative to the 25-period average, the script attempts to filter out "noise" and only highlight signals that occur within a certain structural context.
/*-----------------------------+
|			       |
| Shared by www.Aptrafx.com    |
|			       |
+------------------------------*/

//+------------------------------------------------------------------+
//| 5 Min RSI 12-period qual INDICATOR                               |
//+------------------------------------------------------------------+
#property copyright "Ron T"
#property link      "http://www.lightpatch.com"

#property indicator_chart_window
#property indicator_buffers 8

#property indicator_color1 Red
#property indicator_color2 HotPink
#property indicator_color3 DarkGray
#property indicator_color4 Red

#property indicator_color5 White
#property indicator_color6 LightGray
#property indicator_color7 LightGreen
#property indicator_color8 White


//---- buffers
double Buffer1[];
double Buffer2[];
double Buffer3[];
double Buffer4[];
double Buffer5[];
double Buffer6[];
double Buffer7[];
double Buffer8[];


// User Input


//+------------------------------------------------------------------+
//| Custom indicator initialization function                         |
//|------------------------------------------------------------------|

int init()
  {

   // 233 up arrow
   // 234 down arrow
   // 159 big dot
   // 158 little dot
   // 168 open square
   // 120 box with X

   SetIndexStyle(0,DRAW_ARROW);
   SetIndexBuffer(0, Buffer1);
   SetIndexArrow(0,159);  //up

   SetIndexStyle(1,DRAW_ARROW);
   SetIndexBuffer(1, Buffer2);
   SetIndexArrow(1,159);  //down

   SetIndexStyle(2,DRAW_ARROW);
   SetIndexBuffer(2, Buffer3);
   SetIndexArrow(2,112);

   SetIndexStyle(3,DRAW_ARROW);
   SetIndexBuffer(3, Buffer4);
   SetIndexArrow(3,120);

   SetIndexStyle(4,DRAW_ARROW);
   SetIndexBuffer(4, Buffer5);
   SetIndexArrow(4,159);

   SetIndexStyle(5,DRAW_ARROW);
   SetIndexBuffer(5, Buffer6);
   SetIndexArrow(5,159);

   SetIndexStyle(6,DRAW_ARROW);
   SetIndexBuffer(6, Buffer7);
   SetIndexArrow(6,120);

   SetIndexStyle(7,DRAW_ARROW);
   SetIndexBuffer(7, Buffer8);
   SetIndexArrow(7,120);

   return(0);
  }


//+------------------------------------------------------------------+
//| Custor indicator deinitialization function                       |
//+------------------------------------------------------------------+
int deinit()
  {
   int i;

   for( i=0; i<Bars; i++ ) Buffer1[i]=0;
   for( i=0; i<Bars; i++ ) Buffer2[i]=0;
   for( i=0; i<Bars; i++ ) Buffer3[i]=0;
   for( i=0; i<Bars; i++ ) Buffer4[i]=0;
   for( i=0; i<Bars; i++ ) Buffer5[i]=0;
   for( i=0; i<Bars; i++ ) Buffer6[i]=0;
   for( i=0; i<Bars; i++ ) Buffer7[i]=0;
   for( i=0; i<Bars; i++ ) Buffer8[i]=0;

   return(0);
  }


//+------------------------------------------------------------------+
//| Custom indicator iteration function                              |
//+------------------------------------------------------------------+

// Current position if 55/45 or over/under. Does any of
// the previous 'qual' period ever fall below55/above45? (last11)
//
// If qual*2 periods have been above55/below45
// then lets not try to transact any more (last22)


int start()
  {
   int      pos=Bars-100; // leave room for moving average periods

   double   cMAfst=0, pMAfst=0;
   double   cMAslo=0, pMAslo=0;
   double   MA100=0;

   double p=Point();

   while(pos>=1)
     {

      cMAfst=iMA(Symbol(),0,5,0,MODE_LWMA,PRICE_CLOSE, pos);
      pMAfst=iMA(Symbol(),0,5,0,MODE_LWMA,PRICE_CLOSE, pos+1);

      cMAslo=iMA(Symbol(),0,25,0,MODE_LWMA,PRICE_CLOSE, pos);
      pMAslo=iMA(Symbol(),0,25,0,MODE_LWMA,PRICE_CLOSE, pos+1);

      MA100=iMA(Symbol(),0,100,0,MODE_LWMA,PRICE_CLOSE, pos);

      // rising
      if (pMAfst<=pMAslo && cMAfst>=cMAslo && MA100<cMAslo)
        {
         Buffer8[pos]=cMAfst;
        }

      //falling
      if (pMAfst>=pMAslo && cMAfst<=cMAslo && MA100>cMAslo)
        {
         Buffer4[pos]=cMAfst;
        }

      // possible take-profit mark
      if ((MA100<pMAslo && MA100>cMAslo) || (MA100>pMAslo && MA100<cMAslo))
         {
          Buffer7[pos]=MA100;
         }

 	   pos--;
     }

   return(0);
  }
//+------------------------------------------------------------------+
Comments