3perekosa_i
Download script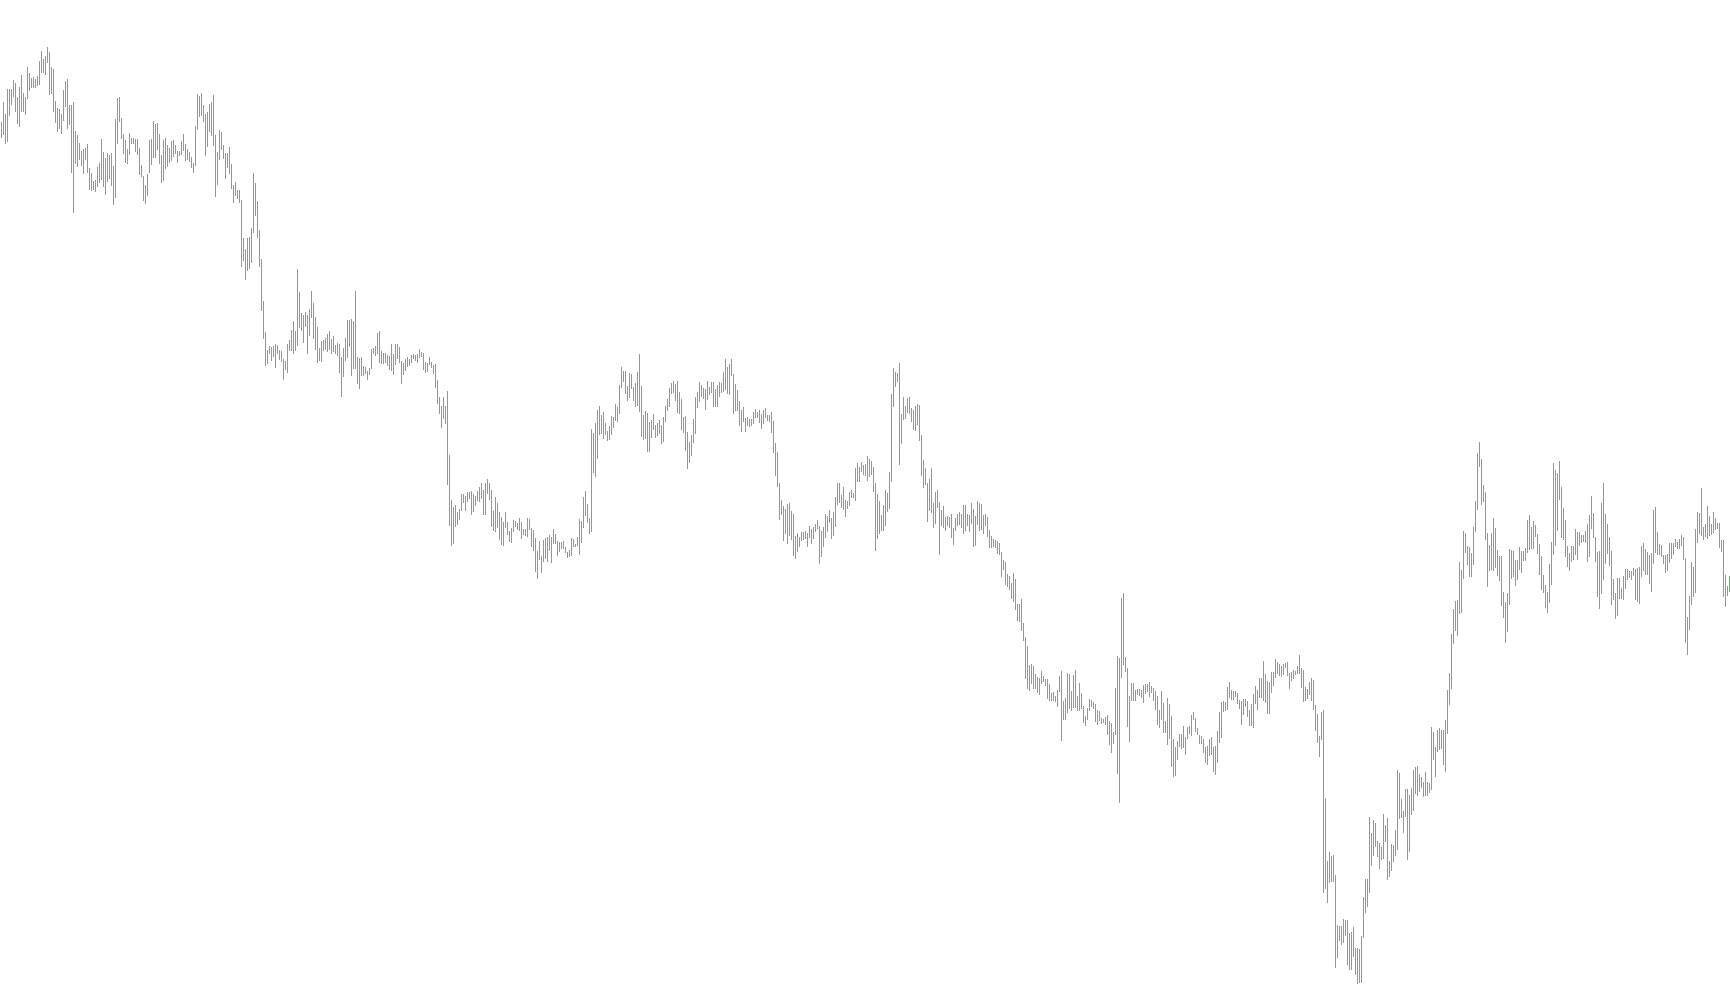
This indicator is designed to provide a visual comparison of different currency pairs simultaneously on a single chart window. Instead of looking at just one pair of currencies, it calculates the mathematical relationship between three specific instruments to help traders identify correlations or deviations in the market.
How the Logic Works
The core functionality of this script relies on relative pricing. It takes three user-defined currency pairs and performs specific calculations to generate three distinct lines on your screen:
- Relationship Analysis: The tool calculates a custom value for each pair by comparing them against a "Cross" pair (the primary reference point). Essentially, it looks at how the two main pairs move in relation to the third one.
- Mathematical Offsetting: By subtracting the values of the "Cross" pair from the products and quotients of the other two pairs, the indicator narrows down the specific variance between these assets. This allows you to see if a currency is over-performing or under-performing compared to its usual historical behavior alongside its peers.
- Customizable Perspective:
- Inversion: There is an option to flip the indicator's values across the horizontal axis. This is useful for visual preferences or when the market sentiment requires viewing the data in a "mirror" format.
- Price Overlay: You can choose to display the actual closing price of your current chart symbol as a reference point, or alternatively, have the script calculate an average of the three processed values to act as a baseline.
Visual Output
When you run this indicator, it populates a separate window with four distinct data points:
- Three Primary Lines: These represent the calculated relationships between your chosen pairs (colored Aqua, Blue, and Red). They allow you to see at a glance if the currencies are moving in harmony or diverging.
- The Baseline: A fourth line (dotted) appears either as the average of the three calculations or as the actual price of the current symbol, depending on your settings.
Practical Use for Traders
This tool is primarily used to spot divergences. If two pairs that usually move together suddenly show a wide gap in their calculated lines, it can signal a potential market shift, a breakdown in correlation, or a specific opportunity in one currency over another based on the strength of the others.
//+------------------------------------------------------------------+
//|                                                    3perekosa.mq4 |
//+------------------------------------------------------------------+
#property copyright "Ïîðó÷èê & aka KimIV"
#property link      "http://www.kimiv.ru"

#property indicator_separate_window
#property indicator_buffers 4
#property indicator_color1 Aqua
#property indicator_color2 Blue
#property indicator_color3 Red
#property indicator_color4 Yellow

//------- Ãëîáàëüíûå ïåðåìåííûå --------------------------------------

//------- Âíåøíèå ïàðàìåòðû èíäèêàòîðà -------------------------------
extern string NameCross    = "GBPCHF"; // Íàèìåíîâàíèå êðîññà
extern string NameMain1    = "GBPUSD"; // Íàèìåíîâàíèå îñíîâíîé ïàðû 1
extern string NameMain2    = "USDCHF"; // Íàèìåíîâàíèå îñíîâíîé ïàðû 2
extern int    NumberOfBars = 1000;     // Êîëè÷åñòâî áàðîâ îáñ÷¸òà (0-âñå)
extern bool   Perevorot    = false;    // Ïåðåâîðà÷èâàåò èíäþêà îòíîñèòåëüíî ãîðèçîíòàëüíîé îñè.
extern bool   ShowMain     = false;    // Îòîáðàæàåò êðèâóþ öåíû ïî òåêóùåìó èíñòðóìåíòó

//------- Áóôåðû èíäèêàòîðà ------------------------------------------
double buf0[], buf1[], buf2[], buf3[];
double P1=0,P2=0,P3=0;

//+------------------------------------------------------------------+
//| Custom indicator initialization function                         |
//+------------------------------------------------------------------+
void init() {
  SetIndexBuffer(0, buf0);
  SetIndexLabel (0, NameCross);
  SetIndexStyle (0, DRAW_LINE, STYLE_SOLID, 2);
  SetIndexEmptyValue(0, 0);

  SetIndexBuffer(1, buf1);
  SetIndexLabel (1, NameMain1);
  SetIndexStyle (1, DRAW_LINE, STYLE_SOLID, 2);
  SetIndexEmptyValue(1, 0);

  SetIndexBuffer(2, buf2);
  SetIndexLabel (2, NameMain2);
  SetIndexStyle (2, DRAW_LINE, STYLE_SOLID, 2);
  SetIndexEmptyValue(2, 0);

  SetIndexBuffer(3, buf3);
  SetIndexLabel (3, Symbol());
  SetIndexStyle (3, DRAW_LINE, STYLE_DOT, 1);
  SetIndexEmptyValue(3, 0);
}

//+------------------------------------------------------------------+
//| Custom indicator deinitialization function                       |
//+------------------------------------------------------------------+
void deinit() {
  Comment("");
}

//+------------------------------------------------------------------+
//| Custom indicator iteration function                              |
//+------------------------------------------------------------------+
void start() {
  int LoopBegin, sh;

      if (NumberOfBars==0) LoopBegin=Bars-1;
  else LoopBegin=NumberOfBars-1;
  LoopBegin=MathMin(Bars-1, LoopBegin);

  for (sh=LoopBegin; sh>=0; sh--) {
    P1=iClose(NameMain1, 0, sh)*iClose(NameMain2, 0, sh)-iClose(NameCross, 0, sh);
    P2=iClose(NameMain1, 0, sh)-iClose(NameCross, 0, sh)/iClose(NameMain2, 0, sh);
    P3=iClose(NameMain2, 0, sh)-iClose(NameCross, 0, sh)/iClose(NameMain1, 0, sh);
    if (Perevorot) {P1=P1*(-1);P2=P2*(-1);P3=P3*(-1);}
    if (ShowMain) {P1=P1+iClose(Symbol(), 0, sh);P2=P2+iClose(Symbol(), 0, sh);P3=P3+iClose(Symbol(), 0, sh);}
    buf0[sh]=P1;
    buf1[sh]=P2;
    buf2[sh]=P3;
    if (ShowMain) buf3[sh]=iClose(Symbol(), 0, sh); else buf3[sh]=(P1+P2+P3)/3;
  }
}
//+------------------------------------------------------------------+
Comments