4hVegasMetaTraderWeeklyChart
Download script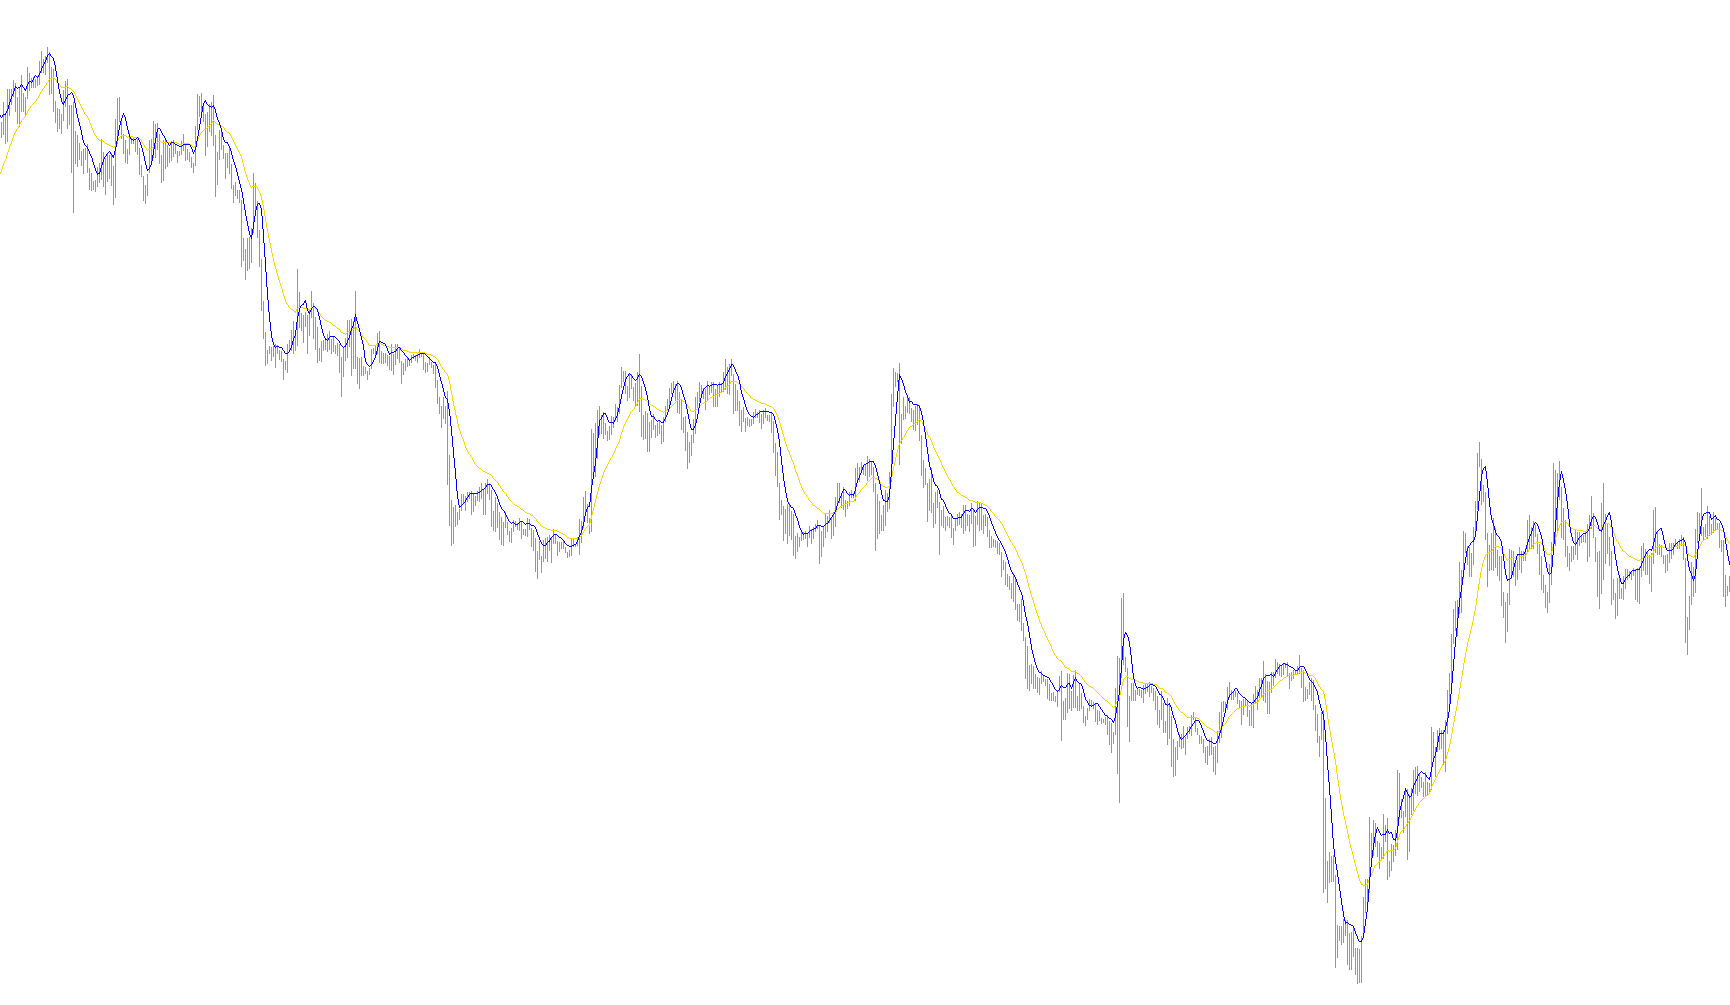
This tool is designed to provide visual clarity on your trading charts by automatically plotting two specific moving average lines based on the "Vegas Model" methodology. It helps traders identify trends and potential momentum shifts by smoothing out price action data.
How the Logic Works
The script analyzes historical price data to calculate and display two distinct types of averages on your screen:
1. Data Source Selection Instead of looking only at the closing price of a candle, this tool looks at the midpoint of each candle (the average between the highest and lowest price reached during that period). By using this "median" point, the lines provide a more balanced representation of the price action.
2. The Two Trend Lines The indicator draws two separate lines on your chart simultaneously:
- The Long-Term Trend (Green Line): This uses an Exponential Moving Average (EMA) set to 21 periods. Because it is "exponential," it reacts more quickly to recent price changes while still maintaining a smooth curve to show the broader trend.
- The Short-Term Momentum (Blue Line): This uses a Simple Moving Average (SMA) set to 5 periods. This line tracks much closer to the immediate price action, helping traders see short-term fluctuations and quick shifts in direction.
Purpose for the Trader
By overlaying these two lines, the tool allows you to visualize the relationship between short-term momentum and the longer-term trend. Traders typically use this to see when the fast-moving line (Short-Term) crosses or pulls away from the slower-moving line (Long-Term), which can be a signal of changing market sentiment.
//+------------------------------------------------------------------+
//| 4Hour Vegas Model - Weekly Chart MA lines                        |
//|                                                           Spiggy |
//|                                                                  |
//+------------------------------------------------------------------+
#property copyright "Spiggy"
#property link      ""

#property indicator_chart_window
#property indicator_buffers 2
#property indicator_color1 Green
#property indicator_color2 Blue


//---- input parameters

//---- buffers
double ExtMapBuffer1[];
double ExtMapBuffer2[];

//+------------------------------------------------------------------+
//| Custom indicator initialization function                         |
//+------------------------------------------------------------------+
int init()
  {
//---- indicators
   SetIndexStyle(0,DRAW_LINE);
   SetIndexBuffer(0,ExtMapBuffer1);
   SetIndexStyle(1,DRAW_LINE);
   SetIndexBuffer(1,ExtMapBuffer2);

//----
   return(0);
  }
//+------------------------------------------------------------------+
//| Custor indicator deinitialization function                       |
//+------------------------------------------------------------------+
int deinit()
  {
//----

//----
   return(0);
  }
//+------------------------------------------------------------------+
//| Custom indicator iteration function                              |
//+------------------------------------------------------------------+
int start()
{
  int    limit;
  int    counted_bars=IndicatorCounted();
  double EMA21;
  double SMA5;

  //---- check for possible errors
  if(counted_bars<0) return(-1);
  //---- last counted bar will be recounted
  if(counted_bars>0) counted_bars--;
  limit=Bars-counted_bars;
  //---- main loop
  for(int i=0; i<limit; i++)
  {
    //---- ma_shift set to 0 because SetIndexShift called abowe
    EMA21=iMA(NULL,0,21,0,MODE_EMA,(PRICE_HIGH+PRICE_LOW)/2,i);
    SMA5 =iMA(NULL,0,5,0,MODE_SMA,(PRICE_HIGH+PRICE_LOW)/2,i);

    ExtMapBuffer1[i] = EMA21;
    ExtMapBuffer2[i] = SMA5;
  }

  return(0);
}
//+------------------------------------------------------------------+
Comments