5_day_breakout
Download script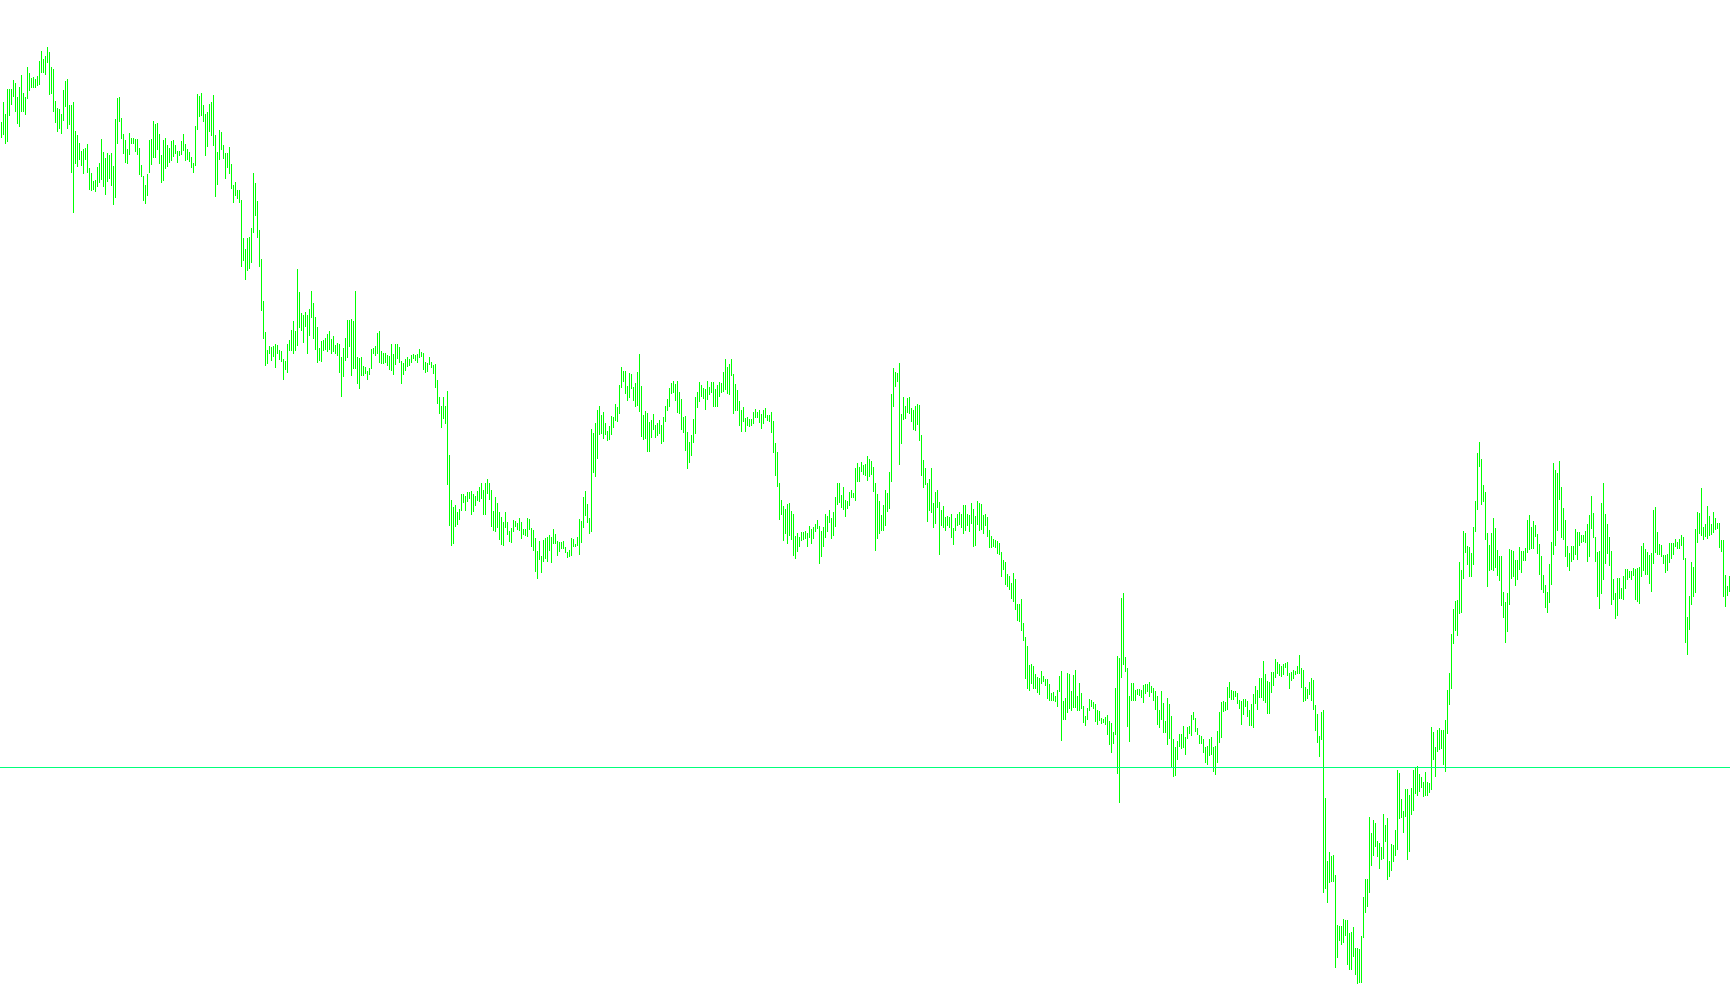
This script is designed to help traders identify significant price boundaries by automatically calculating and displaying the highest and lowest price points reached over a specific period—in this case, the last 5 trading days.
How the Logic Works
1. Data Collection The tool looks back at historical daily data on your chart. It specifically identifies the "High" and "Low" prices for each of the past few days. By looking at the daily timeframe, it ensures that the boundaries are based on full trading sessions rather than minor fluctuations within a single minute or hour.
2. Identifying the Extremes Once the script has gathered the data for the 5-day window, it performs a comparative scan:
- The High Boundary: It scans through all five days to find the single highest price reached.
- The Low Boundary: It simultaneously scans to find the single lowest price reached during that same period.
This process essentially "filters out" the noise of smaller daily movements to highlight the true peak and valley of the recent week.
3. Visual Representation After calculating these two critical levels, the script automatically draws two horizontal lines on your trading chart:
- The Upper Boundary: A solid green line marks the 5-day high.
- The Lower Boundary: A solid red line marks the 5-day low.
4. Dynamic Updates The script is designed to refresh constantly. Every time the market updates, it re-evaluates the 5-day window. If a new high or low is formed, the lines will automatically shift to reflect the new price levels, providing you with a real-time view of current support and resistance zones.
Summary for the Trader
The primary goal of this logic is to provide a clear visual "bracket" for the market. By seeing these two lines, you can easily identify breakout opportunities. When the price moves outside of these boundaries, it signals that the market may be entering a new trend, moving beyond its recent range of consolidation.
//+------------------------------------------------------------------+
//|                                                 5dayBreakout.mq4 |
//|                                                        Bill Sica |
//|                                         http://www.tetsuyama.com |
//+------------------------------------------------------------------+
#property copyright "Bill Sica"
#property link      "http://www.tetsuyama.com"
#property indicator_chart_window
//---- input parameters
extern int       DAYS=5;
//+------------------------------------------------------------------+
//| Custom indicator initialization function                         |
//+------------------------------------------------------------------+
int init()
  {
//---- indicators
   return(0);
  }
//+------------------------------------------------------------------+
//| Custom indicator iteration function                              |
//+------------------------------------------------------------------+
int start()
  {
   double daily_high[20];
   double daily_low[20];
   double yesterday_close;
   double phigh,plow;
   int i=1;
//---- TODO: add your code here
   ArrayResize(daily_high,DAYS);
   ArrayResize(daily_low,DAYS);
   ArrayInitialize(daily_high,0);
   ArrayInitialize(daily_low,0);
   ArrayCopySeries(daily_low, MODE_LOW, Symbol(), PERIOD_D1);
   ArrayCopySeries(daily_high, MODE_HIGH, Symbol(), PERIOD_D1);
/* initialise */
   plow=daily_low[1];
   phigh=daily_high[1];
//----
   for(i=1;i<DAYS;i++)
     {
      if(plow>daily_low[i])
        {
         plow =daily_low[i];
        }
     }
   for(i=1;i<DAYS;i++)
     {
      if(phigh<daily_high[i])
        {
         phigh =daily_high[i];
        }
     }
   Comment("\n5dayH ",phigh,"\n5dayL ",plow);
   //----
   ObjectDelete("5dayHigh");
   ObjectDelete("5dayLow");
   ObjectCreate("5dayHigh", OBJ_HLINE,0, CurTime(),phigh);
   ObjectSet("5dayHigh",OBJPROP_COLOR,SpringGreen);
   ObjectSet("5dayHigh",OBJPROP_STYLE,STYLE_SOLID);
   ObjectCreate("5dayLow", OBJ_HLINE,0, CurTime(),plow);
   ObjectSet("5dayLow",OBJPROP_COLOR,Red);
   ObjectSet("5dayLow",OBJPROP_STYLE,STYLE_SOLID);
   //----
   ObjectsRedraw();
   return(0);
  }
//+------------------------------------------------------------------
Comments