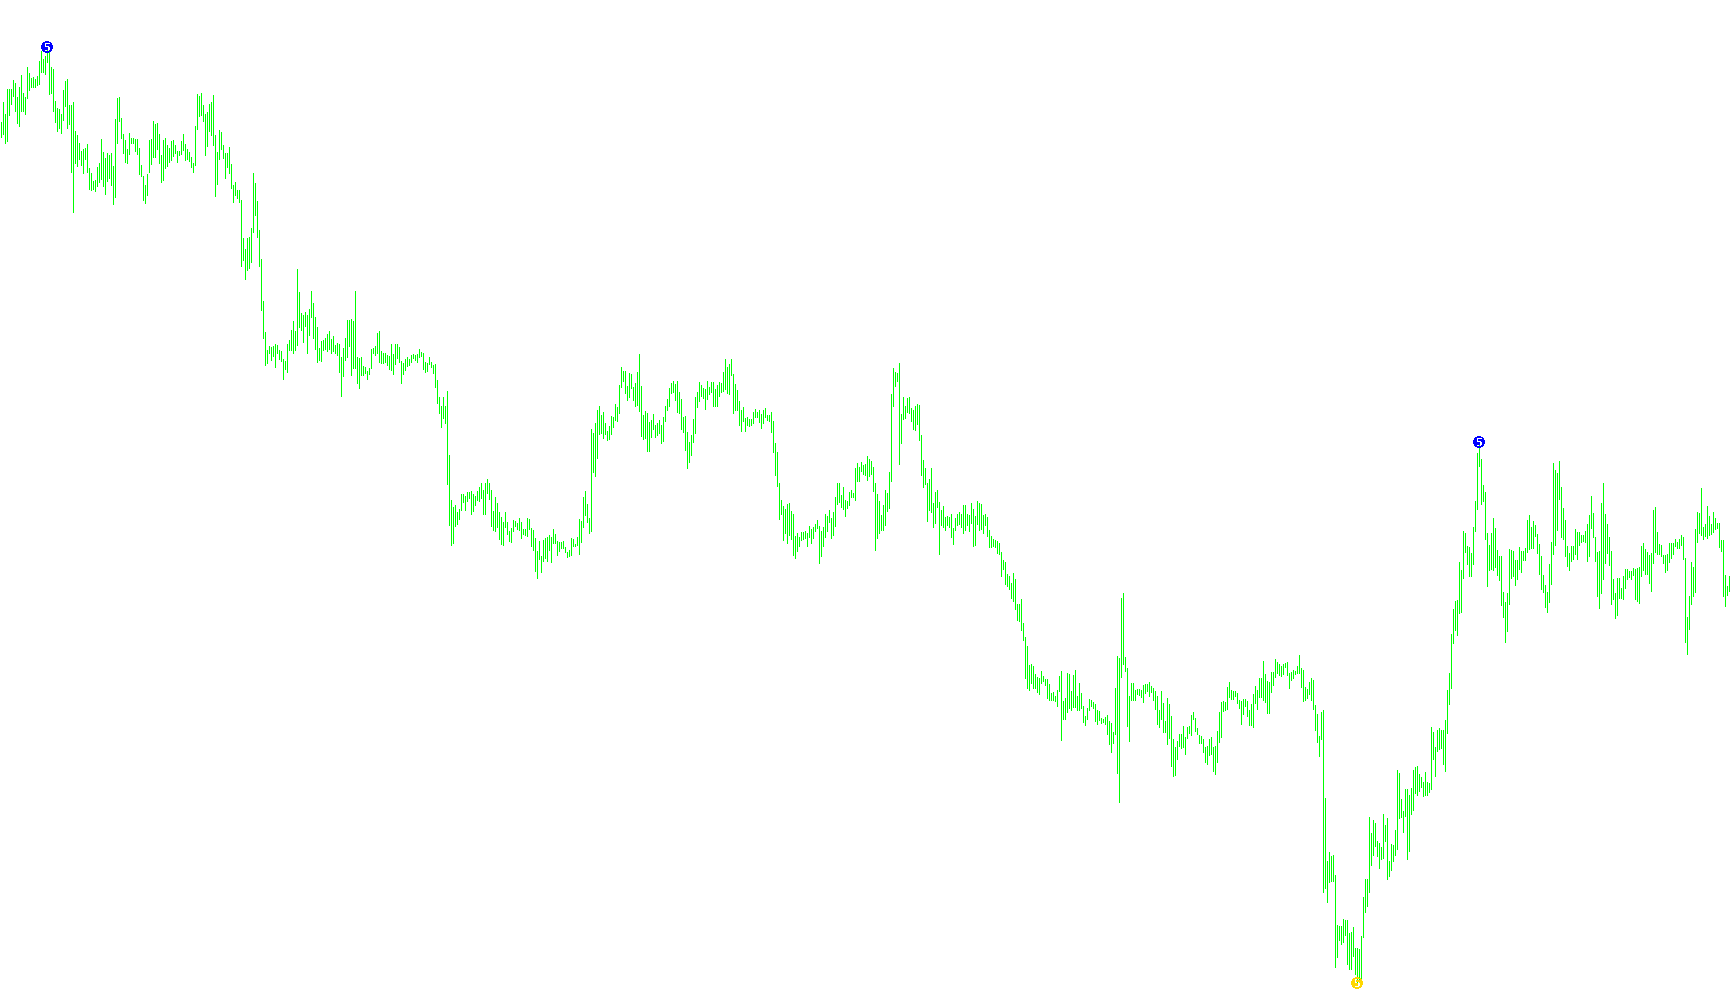
This script is designed to analyze market price movements by identifying significant structural peaks and valleys. It functions as a trend-tracking tool that filters out minor market "noise" to highlight the core direction of price action.
Core Logic Overview
The tool operates by scanning historical price data to locate major highs and lows based on three specific user-defined parameters: depth, deviation, and backstep. Instead of reacting to every tiny fluctuation in price, it looks for substantial shifts that meet a minimum threshold of movement.
How the Analysis Works
- Data Filtering: The script scans the chart to find the highest highs and lowest lows over a specific period. It ignores any price movements that are too small (below the "Deviation" threshold), ensuring that only meaningful trends are captured.
- Peak and Valley Identification: It maps out structural "turning points." When the price moves significantly enough in one direction, the script marks it as a point of interest. If a new high or low is formed that is more significant than a previous one nearby, the script dynamically updates the map to ensure only the most prominent peaks remain.
- Trend Detection: Once these major structural points are identified, the script monitors the sequence of these highs and lows. It essentially looks for the "zigzag" pattern of the market—the way price moves from one major peak to the next major valley.
Alerts and Notifications
The primary objective of this logic is to detect a change in market momentum. The script constantly compares the current structural position with the previous ones. When it detects that the trend has shifted—meaning the price has moved from a series of lower highs to higher highs, or from higher lows to lower lows—it triggers an automated alert.
In simple terms, this tool acts as a sophisticated filter that watches the "big picture" of the market. It ignores the distractions of small price movements and notifies you only when the underlying structure of the market undergoes a significant trend reversal.
#property indicator_chart_window
#property indicator_buffers 2
#property indicator_color1 MediumSpringGreen
#property indicator_color2 MediumSpringGreen
#property indicator_width1 5
#property indicator_width2 5
//---- indicator buffers
double ExtMapBuffer[];
double ExtMapBuffer2[];
int OldLastZigZag, OldPreviousZigZag;
int ExtDepth=200;
int ExtDeviation=75;
int ExtBackstep=15;

//+------------------------------------------------------------------+
//| Custom indicator initialization function                         |
//+------------------------------------------------------------------+
int init()
  {
   IndicatorBuffers(2);
//---- drawing settings
   SetIndexStyle(0,DRAW_ARROW);
   SetIndexArrow(0, 144);
   SetIndexStyle(1,DRAW_ARROW);
   SetIndexArrow(1, 144);
//---- indicator buffers mapping
   SetIndexBuffer(0,ExtMapBuffer);
   SetIndexBuffer(1,ExtMapBuffer2);
   SetIndexEmptyValue(0,0.0);

//---- indicator short name
   IndicatorShortName("5 sing zz alert ("+ExtDepth+","+ExtDeviation+","+ExtBackstep+")");
//---- initialization done
   return(0);
  }
//+------------------------------------------------------------------+
//|                                                                  |
//+------------------------------------------------------------------+
int start()
  {
   int    shift, back,lasthighpos,lastlowpos;
   double val,res;
   double curlow,curhigh,lasthigh,lastlow;

   for(shift=Bars-ExtDepth; shift>=0; shift--)
     {
      val=Low[Lowest(NULL,0,MODE_LOW,ExtDepth,shift)];
      if(val==lastlow) val=0.0;
      else
        {
         lastlow=val;
         if((Low[shift]-val)>(ExtDeviation*Point)) val=0.0;
         else
           {
            for(back=1; back<=ExtBackstep; back++)
              {
               res=ExtMapBuffer[shift+back];
               if((res!=0)&&(res>val)) ExtMapBuffer[shift+back]=0.0;
              }
           }
        }
      ExtMapBuffer[shift]=val;
      //--- high
      val=High[Highest(NULL,0,MODE_HIGH,ExtDepth,shift)];
      if(val==lasthigh) val=0.0;
      else
        {
         lasthigh=val;
         if((val-High[shift])>(ExtDeviation*Point)) val=0.0;
         else
           {
            for(back=1; back<=ExtBackstep; back++)
              {
               res=ExtMapBuffer2[shift+back];
               if((res!=0)&&(res<val)) ExtMapBuffer2[shift+back]=0.0;
              }
           }
        }
      ExtMapBuffer2[shift]=val;
     }

   // final cutting
   lasthigh=-1; lasthighpos=-1;
   lastlow=-1;  lastlowpos=-1;

   for(shift=Bars-ExtDepth; shift>=0; shift--)
     {
      curlow=ExtMapBuffer[shift];
      curhigh=ExtMapBuffer2[shift];
      if((curlow==0)&&(curhigh==0)) continue;
      //---
      if(curhigh!=0)
        {
         if(lasthigh>0)
           {
            if(lasthigh<curhigh) ExtMapBuffer2[lasthighpos]=0;
            else ExtMapBuffer2[shift]=0;
           }
         //---
         if(lasthigh<curhigh || lasthigh<0)
           {
            lasthigh=curhigh;
            lasthighpos=shift;
           }
         lastlow=-1;
        }
      //----
      if(curlow!=0)
        {
         if(lastlow>0)
           {
            if(lastlow>curlow) ExtMapBuffer[lastlowpos]=0;
            else ExtMapBuffer[shift]=0;
           }
         //---
         if((curlow<lastlow)||(lastlow<0))
           {
            lastlow=curlow;
            lastlowpos=shift;
           }
         lasthigh=-1;
        }
     }

   for(shift=Bars-1; shift>=0; shift--)
     {
      if(shift>=Bars-ExtDepth) ExtMapBuffer[shift]=0.0;
      else
        {
         res=ExtMapBuffer2[shift];
         if(res!=0.0) ExtMapBuffer2[shift]=res;
        }
  	int i=0;
  	int LastZigZag, PreviousZigZag;

   int h=0;
   while ( ExtMapBuffer[h]==0 && ExtMapBuffer2[h]==0) {
   	h++;
   }

   LastZigZag=h;

   h++;
   while(ExtMapBuffer[h]==0 && ExtMapBuffer2[h]==0) {
   	h++;
   }

   PreviousZigZag=h;

   if (OldLastZigZag!=LastZigZag || OldPreviousZigZag!=PreviousZigZag) {
   	if(OldLastZigZag>LastZigZag) Alert("trend change (M",Period()," ",Symbol(),")");
    	OldLastZigZag=LastZigZag;
   	OldPreviousZigZag=PreviousZigZag;
  }
   if (OldLastZigZag!=LastZigZag || OldPreviousZigZag!=PreviousZigZag) {
   	if(OldLastZigZag<LastZigZag) Alert("trend change (M",Period()," ",Symbol(),")");
   	OldLastZigZag=LastZigZag;
   	OldPreviousZigZag=PreviousZigZag;
   }
     }
  }
Comments