5min_rsi_qual_02IND
Download script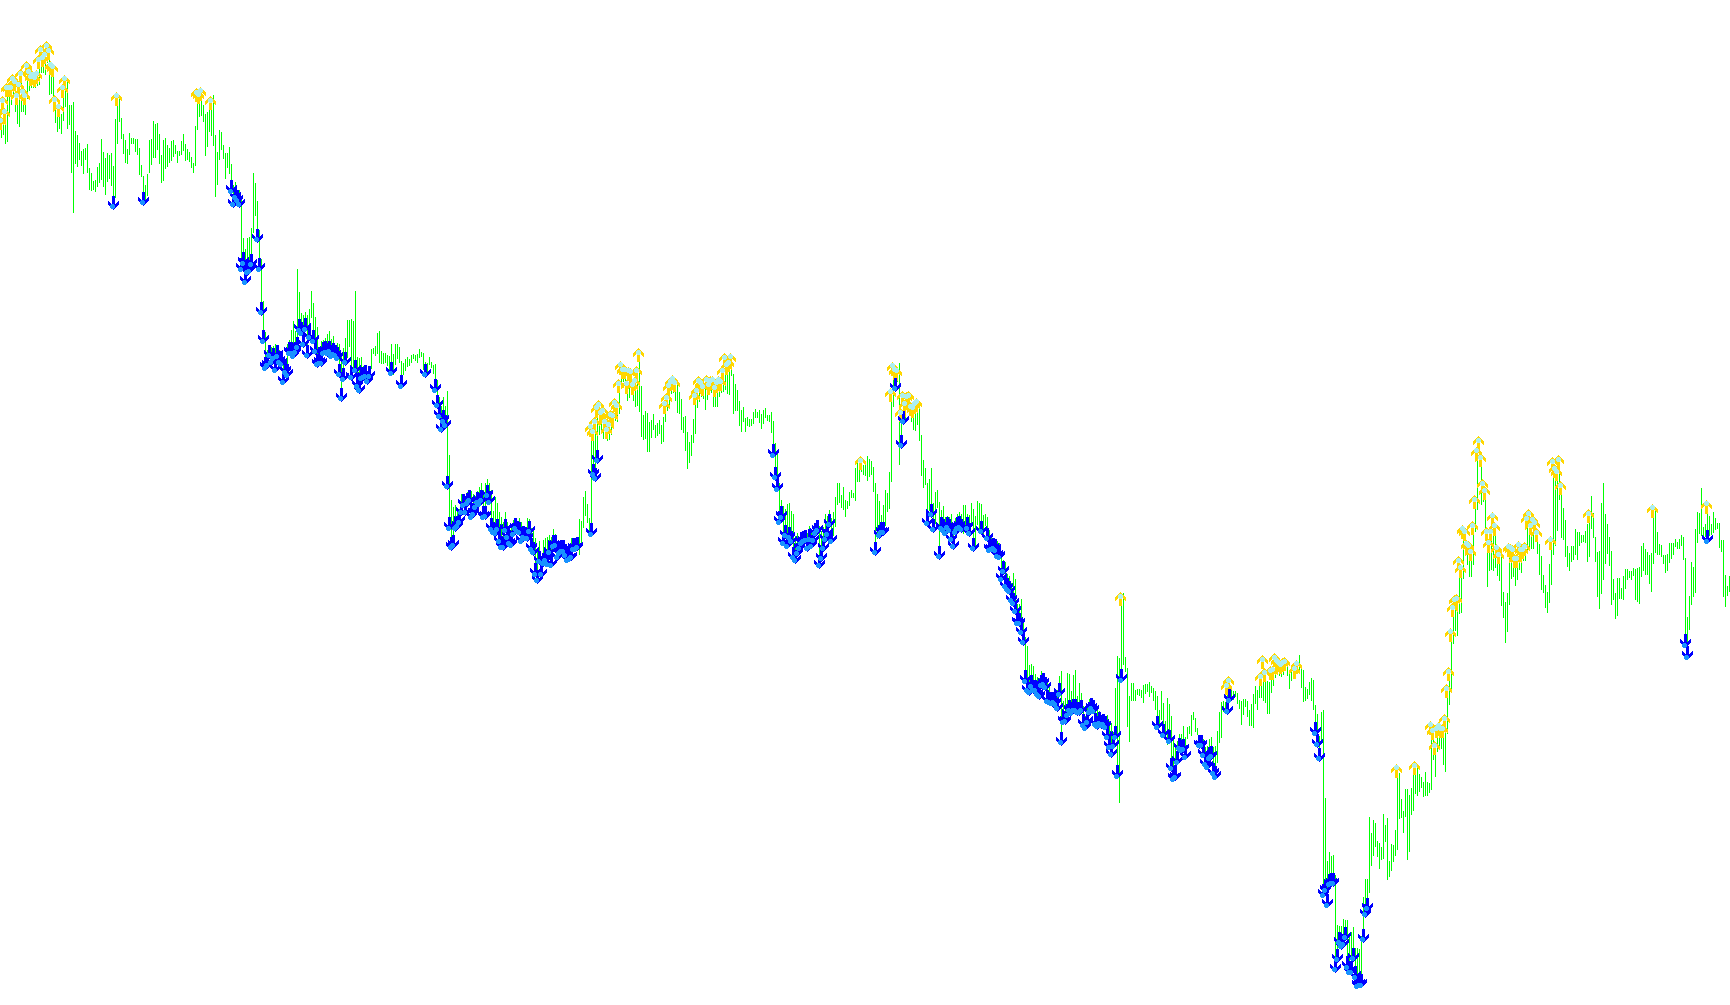
This script is a technical analysis tool designed for the MetaTrader platform. It functions by monitoring price momentum to identify potential trend shifts and provide visual cues directly on your trading chart.
Core Logic Overview
The tool utilizes a standard financial metric called the Relative Strength Index (RSI). By calculating the RSI over a specific timeframe, the script determines whether a market is currently experiencing strong upward momentum, downward momentum, or moving sideways.
Instead of simply reacting to every small price movement, the logic employs a "qualification" system. It looks for sustained strength rather than momentary spikes to filter out market noise.
How it Works
The script continuously scans historical and real-time price data using two primary thresholds:
- Bullish Momentum (Upper Threshold): When the RSI value meets or exceeds a specific high level (55), the script begins looking for an upward trend. However, to confirm this isn't just a temporary "pop" in price, it checks the previous 11 candles. If the momentum remains consistently high throughout that period, it validates the move as a qualifying trend.
- Bearish Momentum (Lower Threshold): Conversely, when the RSI drops to or below a specific low level (45), the script looks for downward pressure. It similarly examines the preceding 11 candles; if the downward movement is sustained across that window, it validates the signal.
Visual Indicators
Once the logic confirms a qualified trend, it places visual markers on your chart to alert you:
- Trend Arrows: The script uses specific arrow symbols to point out where these momentum shifts are occurring.
- Signal Differentiation: Because the script distinguishes between "qualified" trends (sustained momentum) and "unqualified" moves (isolated spikes), it uses different types of markers or slight offsets in position. This allows you to visually differentiate between a high-conviction trend move and a weaker, less reliable price action.
Summary for Traders
In short, this tool acts as a momentum filter. Rather than giving you a signal every time the price moves up or down slightly, it waits for the market to demonstrate consistent strength over a defined period (11 candles). When that consistency is met, it provides clear visual signals on your chart to highlight potential trading opportunities based on sustained market direction.
//+------------------------------------------------------------------+
//| 5 Min RSI 12-period qual INDICATOR                               |
//+------------------------------------------------------------------+
#property copyright "Ron T"
#property link      "http://www.lightpatch.com"

#property indicator_chart_window
#property indicator_buffers 7
#property indicator_color1 HotPink  // arrow up
#property indicator_color2 HotPink  // arrow down
#property indicator_color3 Aqua
#property indicator_color4 Red
#property indicator_color5 White
#property indicator_color6 HotPink
#property indicator_color7 LimeGreen

//---- buffers
double ExtMapBuffer1[];
double ExtMapBuffer2[];
double ExtMapBuffer3[];
double ExtMapBuffer4[];
double ExtMapBuffer5[];
double ExtMapBuffer6[];
double ExtMapBuffer7[];


// User Input


//+------------------------------------------------------------------+
//| Custom indicator initialization function                         |
//|------------------------------------------------------------------|

int init()
  {

   // 233 up arrow
   // 234 down arrow
   // 159 big dot
   // 168 open square

   SetIndexStyle(0,DRAW_ARROW);
   SetIndexBuffer(0, ExtMapBuffer1);
   SetIndexArrow(0,233);  //up

   SetIndexStyle(1,DRAW_ARROW);
   SetIndexBuffer(1, ExtMapBuffer2);
   SetIndexArrow(1,234);  //down

   SetIndexStyle(2,DRAW_ARROW);
   SetIndexBuffer(2, ExtMapBuffer3);
   SetIndexArrow(2,159);

   SetIndexStyle(3,DRAW_ARROW);
   SetIndexBuffer(3, ExtMapBuffer4);
   SetIndexArrow(3,159);

   SetIndexStyle(4,DRAW_ARROW);
   SetIndexBuffer(4, ExtMapBuffer5);
   SetIndexArrow(4,159);

   SetIndexStyle(5,DRAW_ARROW);
   SetIndexBuffer(5, ExtMapBuffer6);
   SetIndexArrow(5,159);

   SetIndexStyle(6,DRAW_ARROW);
   SetIndexBuffer(6, ExtMapBuffer7);
   SetIndexArrow(6,159);

   return(0);
  }


//+------------------------------------------------------------------+
//| Custor indicator deinitialization function                       |
//+------------------------------------------------------------------+
int deinit()
  {
   int i;

   for( i=0; i<Bars; i++ ) ExtMapBuffer1[i]=0;
   for( i=0; i<Bars; i++ ) ExtMapBuffer2[i]=0;
   for( i=0; i<Bars; i++ ) ExtMapBuffer3[i]=0;
   for( i=0; i<Bars; i++ ) ExtMapBuffer4[i]=0;
   for( i=0; i<Bars; i++ ) ExtMapBuffer5[i]=0;
   for( i=0; i<Bars; i++ ) ExtMapBuffer6[i]=0;
   for( i=0; i<Bars; i++ ) ExtMapBuffer7[i]=0;

   return(0);
  }


//+------------------------------------------------------------------+
//| Custom indicator iteration function                              |
//+------------------------------------------------------------------+
int start()
  {
   double   rsi=0;        // Relative Strength Indicator
   int      i=0;
   int      pos=Bars-100; // leave room for moving average periods

   bool   last11=true;        // qualify flag
   bool   last22=true;        // qualify flag

   while(pos>=0)
     {

      rsi=iRSI(Symbol(),0,28,PRICE_CLOSE,pos);

      if (rsi>=55)
        {
         ExtMapBuffer1[pos]=High[pos];

         last11=false;
         for(i=pos; i<pos+11; i++)
           {
            rsi=iRSI(Symbol(),0,28,PRICE_CLOSE,i);
            if (rsi >= 55.0) last11=true;
           }

         if (last11 == true)
           {
            ExtMapBuffer3[pos]=High[pos]+0.0001;
           }
           else
           {
            ExtMapBuffer5[pos]=High[pos]+0.0002;
           }

         // if this is the 2nd time that it's been ABOVE
         // then lets not trade against the trend any more
         //last22=false;
         //for(i=pos; i<pos+22; i++)
         //  {
         //   if (iRSI(Symbol(),0,28,PRICE_CLOSE,i)>=55) last22=true;
         //  }
         //if (last22 == true) ExtMapBuffer3[pos]=High[pos];

         //if (last11==true && last22==false)
         //  {
         //   ExtMapBuffer5[pos]=High[pos]+0.0003;
         //  }
        }

      if (rsi<=45)
       {
        ExtMapBuffer2[pos]=Low[pos];

         last11=false;
         for(i=pos; i<(pos+11); i++)
           {
            if (iRSI(Symbol(),0,28,PRICE_CLOSE,i)<=45) last11=true;
           }
         if (last11 == true)
           {
            ExtMapBuffer4[pos]=Low[pos]-0.0001;
           }
           else
           {
            ExtMapBuffer6[pos]=Low[pos]-0.0002;
           }

         // if this is the 2nd time that it's been BELOW
         // then lets not trade against the trend any more
         //last22=false;
         //for(i=pos; i<(pos+(qual*2)); i++)
         //  {
         //   if (iRSI(Symbol(),0,28,PRICE_CLOSE,i)<=45) last22=true;
         //  }
         //if (last22 == true) ExtMapBuffer4[pos]=Low[pos];

         //if (last11==true && last22==false)
         //  {
         //   ExtMapBuffer6[pos]=Low[pos];
         //  }
        }

 	   pos--;
     }

   return(0);
  }
//+------------------------------------------------------------------+
Comments