5minYANS_IND_02
Download script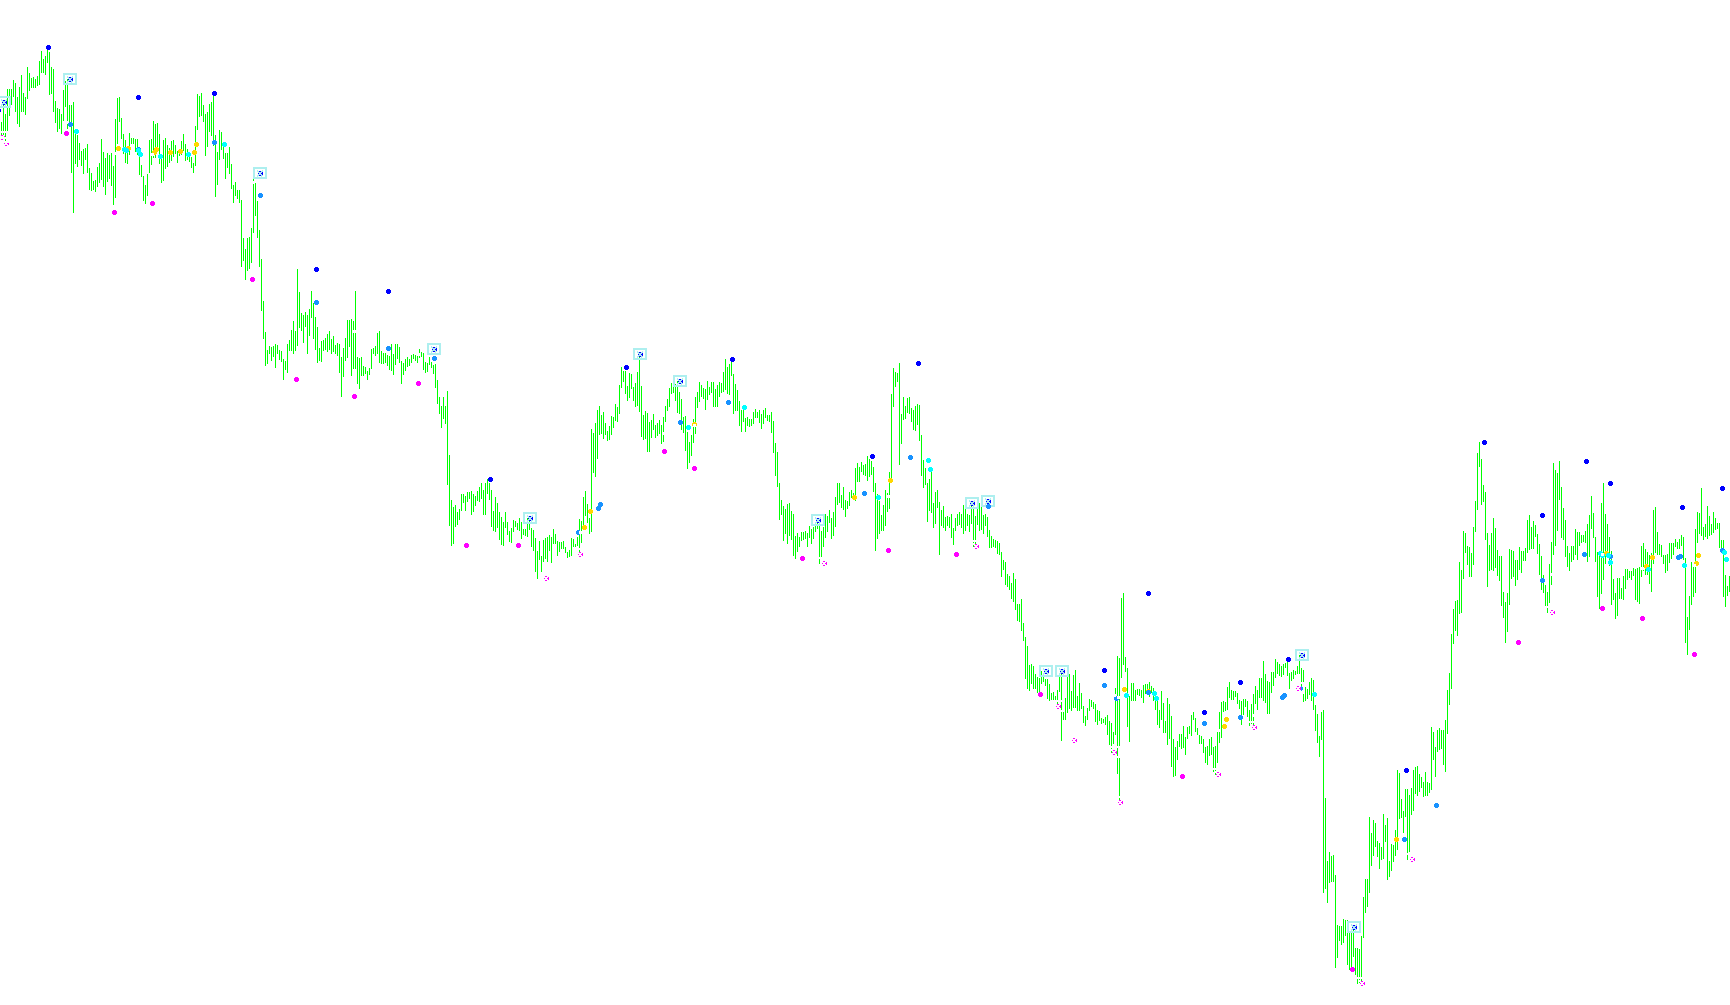
This indicator is designed to analyze price movements by identifying specific momentum shifts and trend reversals using a combination of three technical tools: Exponential Moving Averages (EMA), the Parabolic SAR (Stop and Reverse), and a "qualification" logic that filters out noise.
The logic operates through several layers of verification:
Core Trend Identification
The script monitors the relationship between two different moving averages—a short-term 10-period EMA and a longer-term 40-period EMA.
- Crossover Alerts: It tracks whenever these two lines cross each other. A rising cross (where the short-term average moves above the long-term) suggests upward momentum, while a falling cross suggests downward momentum.
- SAR Interaction: The tool also monitors the Parabolic SAR indicator in relation to the 40-period EMA. It flags instances where the SAR crosses this moving average, providing an additional layer of trend confirmation.
Momentum and Reversal Tracking
The script continuously calculates how long the price has remained above or below the Parabolic SAR. This "duration tracking" is key to its filtering system:
- Rising/Falling SAR: It identifies specific points where the SAR flips direction (moving from below the high of a candle to above it, or vice versa).
The "Qualification" Filter
What distinguishes this script from standard indicators is its "qualification" logic. It doesn't just alert you on every crossover; it looks at the history of the moves:
- Time-Based Validation: It uses a counter to measure how many periods have passed since the last moving average cross occurred.
- Condition-Specific Signals: For certain signals (represented by specific icons like the "Box" indicator), the script only triggers an alert if two conditions are met simultaneously:
- The current trend reversal (SAR flip) must be relatively fresh (occurring within 7 periods).
- The distance from the previous moving average cross must be significant (at least 7 periods ago).
Visual Output
Instead of drawing complex lines that clutter the chart, the script translates these mathematical conditions into visual markers:
- Arrows: Represent primary trend changes and crosses between averages or the SAR.
- Box/Square Markers: Represent "qualified" signals where the momentum shift is deemed mathematically significant based on the timing logic described above.
In summary, this tool acts as a sophisticated filter that looks for moving average crossovers and Parabolic SAR flips, but only highlights the ones that occur under specific time-sensitive conditions to help traders identify higher-quality entries.
//+------------------------------------------------------------------+
//| 5 Min RSI 12-period qual INDICATOR                               |
//+------------------------------------------------------------------+
#property copyright "Ron T"
#property link      "http://www.lightpatch.com"

#property indicator_chart_window
#property indicator_buffers 8

#property indicator_color1 Red
#property indicator_color2 HotPink
#property indicator_color3 Red
#property indicator_color4 MistyRose

#property indicator_color5 White
#property indicator_color6 LightGray
#property indicator_color7 White
#property indicator_color8 DarkGray


//---- buffers
double Buffer1[];
double Buffer2[];
double Buffer3[];
double Buffer4[];
double Buffer5[];
double Buffer6[];
double Buffer7[];
double Buffer8[];


// User Input


//+------------------------------------------------------------------+
//| Custom indicator initialization function                         |
//|------------------------------------------------------------------|

int init()
  {

   // 233 up arrow
   // 234 down arrow
   // 159 big dot
   // 168 open square
   // 120 box with X

   SetIndexStyle(0,DRAW_ARROW);
   SetIndexBuffer(0, Buffer1);
   SetIndexArrow(0,159);  //up

   SetIndexStyle(1,DRAW_ARROW);
   SetIndexBuffer(1, Buffer2);
   SetIndexArrow(1,159);  //down

   SetIndexStyle(2,DRAW_ARROW);
   SetIndexBuffer(2, Buffer3);
   SetIndexArrow(2,120);

   SetIndexStyle(3,DRAW_ARROW);
   SetIndexBuffer(3, Buffer4);
   SetIndexArrow(3,159);

   SetIndexStyle(4,DRAW_ARROW);
   SetIndexBuffer(4, Buffer5);
   SetIndexArrow(4,159);

   SetIndexStyle(5,DRAW_ARROW);
   SetIndexBuffer(5, Buffer6);
   SetIndexArrow(5,159);

   SetIndexStyle(6,DRAW_ARROW);
   SetIndexBuffer(6, Buffer7);
   SetIndexArrow(6,120);

   SetIndexStyle(7,DRAW_ARROW);
   SetIndexBuffer(7, Buffer8);
   SetIndexArrow(7,159);

   return(0);
  }


//+------------------------------------------------------------------+
//| Custor indicator deinitialization function                       |
//+------------------------------------------------------------------+
int deinit()
  {
   int i;

   for( i=0; i<Bars; i++ ) Buffer1[i]=0;
   for( i=0; i<Bars; i++ ) Buffer2[i]=0;
   for( i=0; i<Bars; i++ ) Buffer3[i]=0;
   for( i=0; i<Bars; i++ ) Buffer4[i]=0;
   for( i=0; i<Bars; i++ ) Buffer5[i]=0;
   for( i=0; i<Bars; i++ ) Buffer6[i]=0;
   for( i=0; i<Bars; i++ ) Buffer7[i]=0;
   for( i=0; i<Bars; i++ ) Buffer8[i]=0;

   return(0);
  }


//+------------------------------------------------------------------+
//| Custom indicator iteration function                              |
//+------------------------------------------------------------------+

// Current position if 55/45 or over/under. Does any of
// the previous 'qual' period ever fall below55/above45? (last11)
//
// If qual*2 periods have been above55/below45
// then lets not try to transact any more (last22)


int start()
  {
   int      pos=Bars-100; // leave room for moving average periods

   double   cEMA10=0, pEMA10=0;
   double   cEMA40=0, pEMA40=0;
   double   cSAR=0,   pSAR=10;

   int      dCROSS;    // how many periods since last MA cross

   int      above=0;   // how long SAR has been up
   int      below=0;   // how long SAR has been down


   while(pos>=0)
     {

      cEMA10=iMA(Symbol(),0,10,0,MODE_EMA,PRICE_CLOSE, pos);
      pEMA10=iMA(Symbol(),0,10,0,MODE_EMA,PRICE_CLOSE, pos+1);
      cEMA40=iMA(Symbol(),0,40,0,MODE_EMA,PRICE_CLOSE, pos);
      pEMA40=iMA(Symbol(),0,40,0,MODE_EMA,PRICE_CLOSE, pos+1);
      cSAR=iSAR(Symbol(),0,0.02,0.2,pos);
      pSAR=iSAR(Symbol(),0,0.02,0.2,pos+1);

      if (pEMA10<cEMA40 && cEMA10>cEMA40)
        {
         Buffer1[pos]=cEMA10; // rising cross
         dCROSS=0;
        }
      if (pEMA10>cEMA40 && cEMA10<cEMA40)
        {
         Buffer5[pos]=cEMA10; // falling cross
         dCROSS=0;
        }

      if (pSAR<cEMA40 && cSAR>cEMA40) Buffer4[pos]=cEMA40; //rising SAR/EMA40 cross
      if (pSAR>cEMA40 && cSAR<cEMA40) Buffer8[pos]=cEMA40; //falling SAR/EMA40 cross

      if (cSAR>High[pos]) above++;  // count how long SAR has been up
      if (cSAR<Low[pos])  below++;  // count how long SAR has been down

      if (pSAR<cSAR && cSAR>=High[pos])
        {
         Buffer2[pos]=cSAR;                             // rising SAR
         if (below<=7 && dCROSS>=7) Buffer3[pos]=cSAR;  // Box Indicator RED
         above=0;
         below=0;
        }

      if (pSAR>cSAR && cSAR<=Low[pos])
        {
         Buffer6[pos]=cSAR;                             // falling SAR
         if (above<=7 && dCROSS>=7) Buffer7[pos]=cSAR;  // Box Indicator WHITE
         above=0;
         below=0;
        }

      dCROSS++;                            // distance from any cross

 	   pos--;
     }

   return(0);
  }
//+------------------------------------------------------------------+
Comments