5minYANS_IND_02_v1
Download script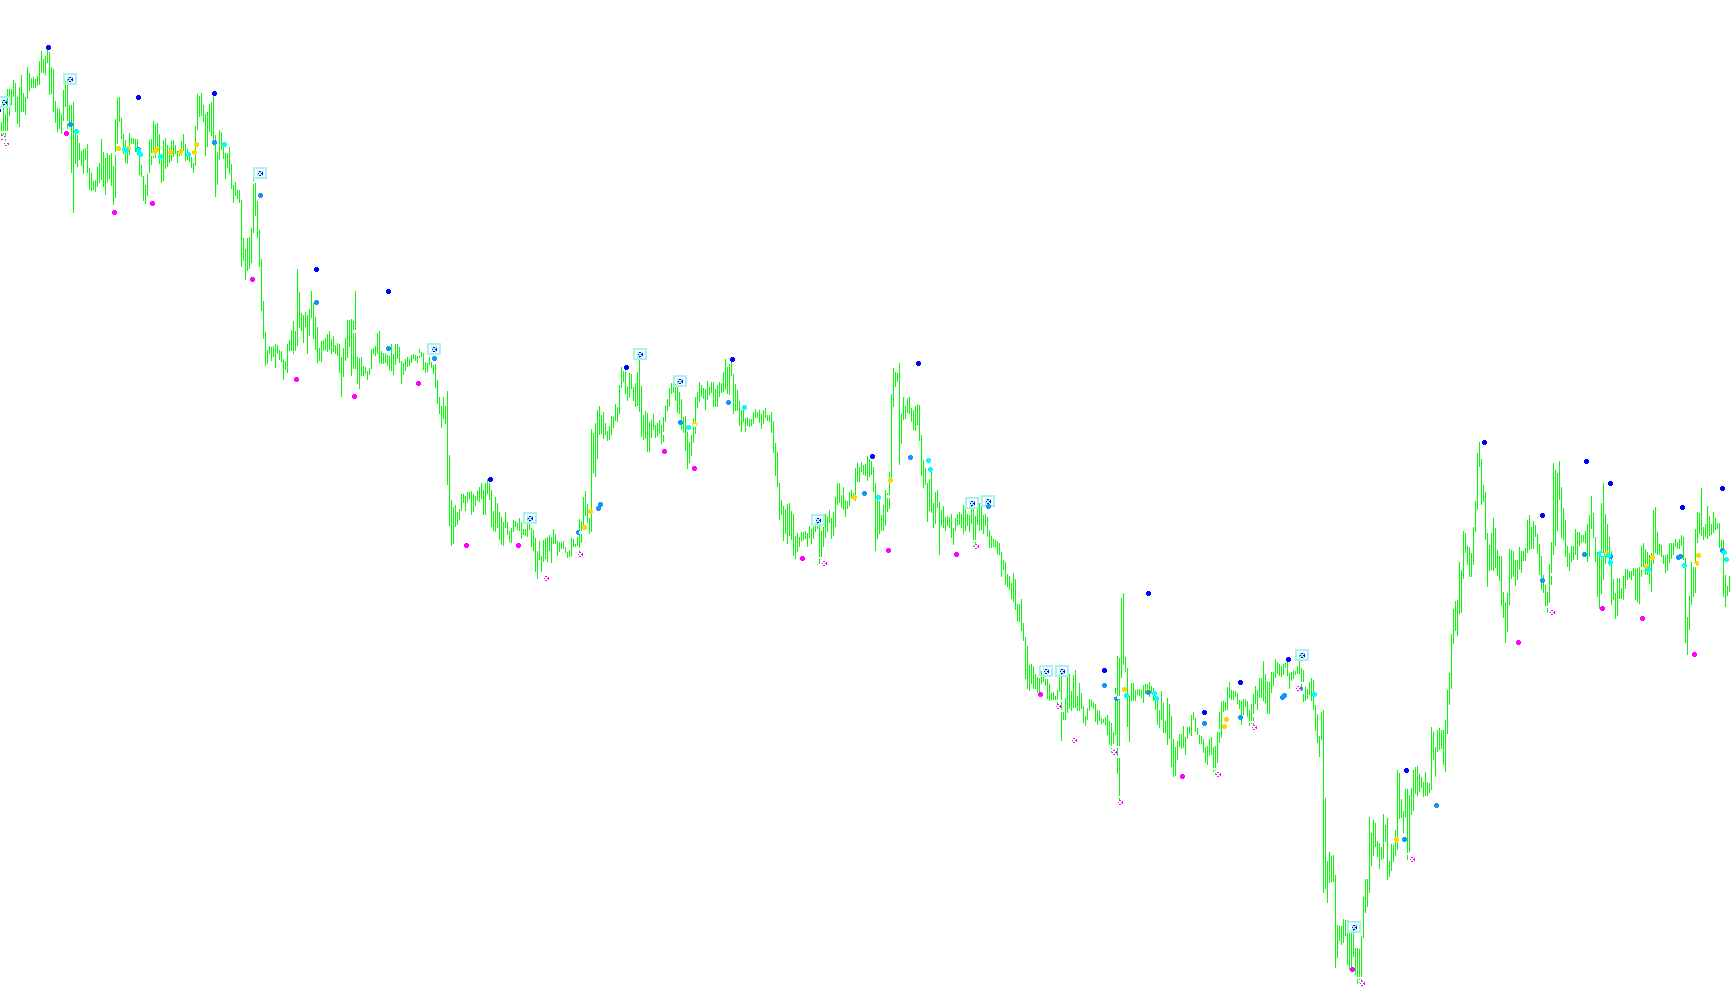
This custom indicator for the MetaTrader platform is designed to identify specific momentum shifts and trend reversals by analyzing the interaction between three primary technical components: Exponential Moving Averages (EMA), Parabolic Sarin (SAR) values, and price action history.
Instead of providing a single signal, the tool monitors these mathematical relationships to plot various visual cues—such as arrows and boxes—directly on your trading chart to highlight key market behaviors.
Core Logic and Analysis
The script functions by scanning historical price data and calculating three distinct variables simultaneously:
- Dual Moving Averages (EMA 10 & EMA 40): The tool monitors the "crossover" points where a short-term average (10 periods) intersects with a longer-term average (40 periods). These intersections typically represent changes in immediate momentum.
- Parabolic SAR: This is used to track the "trend ceiling" or "floor." The indicator measures how long the price has remained above or below these SAR levels to determine the strength and duration of the current trend.
- Cross-Reference Tracking: The script doesn't just look at these values in isolation; it tracks the distance (number of candles) since the last Moving Average crossover occurred.
How the Signals are Generated
The indicator interprets the data to provide several types of visual feedback:
- Trend Crosses: It identifies "Rising Crosses" (where the short-term average moves above the long-term) and "Falling Crosses" (where it moves below). These are marked visually to indicate potential shifts in the primary trend direction.
- SAR Interactions: The script looks for moments where the Parabolic SAR crosses the 40-period Moving Average. These points often signal a transition between different market phases.
- Qualitative Trend Filtering: One of the more sophisticated parts of this logic is the "Box" system (the white and red markers). For these to appear, the script checks for specific conditions:
- It verifies if the trend has been sustained for a specific duration.
- It ensures that the move is occurring at a significant distance from the previous Moving Average crossover.
- This serves as a "quality filter," attempting to distinguish between minor price fluctuations and more significant, high-probability trend reversals.
Summary of Visual Output
By combining these layers of logic, the indicator provides a multi-layered view of the market:
- Arrows: Signal immediate momentum shifts or SAR movements.
- Boxes/Dots: Highlight filtered signals where multiple conditions (trend duration, crossover distance, and price action) align to suggest a higher-quality setup.
/*-----------------------------+
|			       |
| Shared by www.Aptrafx.com    |
|			       |
+------------------------------*/

//+------------------------------------------------------------------+
//| 5 Min RSI 12-period qual INDICATOR                               |
//+------------------------------------------------------------------+
#property copyright "Ron T"
#property link      "http://www.lightpatch.com"

#property indicator_chart_window
#property indicator_buffers 8

#property indicator_color1 Red
#property indicator_color2 HotPink
#property indicator_color3 Red
#property indicator_color4 MistyRose

#property indicator_color5 White
#property indicator_color6 LightGray
#property indicator_color7 White
#property indicator_color8 DarkGray


//---- buffers
double Buffer1[];
double Buffer2[];
double Buffer3[];
double Buffer4[];
double Buffer5[];
double Buffer6[];
double Buffer7[];
double Buffer8[];


// User Input


//+------------------------------------------------------------------+
//| Custom indicator initialization function                         |
//|------------------------------------------------------------------|

int init()
  {

   // 233 up arrow
   // 234 down arrow
   // 159 big dot
   // 168 open square
   // 120 box with X

   SetIndexStyle(0,DRAW_ARROW);
   SetIndexBuffer(0, Buffer1);
   SetIndexArrow(0,159);  //up

   SetIndexStyle(1,DRAW_ARROW);
   SetIndexBuffer(1, Buffer2);
   SetIndexArrow(1,159);  //down

   SetIndexStyle(2,DRAW_ARROW);
   SetIndexBuffer(2, Buffer3);
   SetIndexArrow(2,120);

   SetIndexStyle(3,DRAW_ARROW);
   SetIndexBuffer(3, Buffer4);
   SetIndexArrow(3,159);

   SetIndexStyle(4,DRAW_ARROW);
   SetIndexBuffer(4, Buffer5);
   SetIndexArrow(4,159);

   SetIndexStyle(5,DRAW_ARROW);
   SetIndexBuffer(5, Buffer6);
   SetIndexArrow(5,159);

   SetIndexStyle(6,DRAW_ARROW);
   SetIndexBuffer(6, Buffer7);
   SetIndexArrow(6,120);

   SetIndexStyle(7,DRAW_ARROW);
   SetIndexBuffer(7, Buffer8);
   SetIndexArrow(7,159);

   return(0);
  }


//+------------------------------------------------------------------+
//| Custor indicator deinitialization function                       |
//+------------------------------------------------------------------+
int deinit()
  {
   int i;

   for( i=0; i<Bars; i++ ) Buffer1[i]=0;
   for( i=0; i<Bars; i++ ) Buffer2[i]=0;
   for( i=0; i<Bars; i++ ) Buffer3[i]=0;
   for( i=0; i<Bars; i++ ) Buffer4[i]=0;
   for( i=0; i<Bars; i++ ) Buffer5[i]=0;
   for( i=0; i<Bars; i++ ) Buffer6[i]=0;
   for( i=0; i<Bars; i++ ) Buffer7[i]=0;
   for( i=0; i<Bars; i++ ) Buffer8[i]=0;

   return(0);
  }


//+------------------------------------------------------------------+
//| Custom indicator iteration function                              |
//+------------------------------------------------------------------+

// Current position if 55/45 or over/under. Does any of
// the previous 'qual' period ever fall below55/above45? (last11)
//
// If qual*2 periods have been above55/below45
// then lets not try to transact any more (last22)


int start()
  {
   int      pos=Bars-100; // leave room for moving average periods

   double   cEMA10=0, pEMA10=0;
   double   cEMA40=0, pEMA40=0;
   double   cSAR=0,   pSAR=10;

   int      dCROSS;    // how many periods since last MA cross

   int      above=0;   // how long SAR has been up
   int      below=0;   // how long SAR has been down


   while(pos>=0)
     {

      cEMA10=iMA(Symbol(),0,10,0,MODE_EMA,PRICE_CLOSE, pos);
      pEMA10=iMA(Symbol(),0,10,0,MODE_EMA,PRICE_CLOSE, pos+1);
      cEMA40=iMA(Symbol(),0,40,0,MODE_EMA,PRICE_CLOSE, pos);
      pEMA40=iMA(Symbol(),0,40,0,MODE_EMA,PRICE_CLOSE, pos+1);
      cSAR=iSAR(Symbol(),0,0.02,0.2,pos);
      pSAR=iSAR(Symbol(),0,0.02,0.2,pos+1);

      if (pEMA10<cEMA40 && cEMA10>cEMA40)
        {
         Buffer1[pos]=cEMA10; // rising cross
         dCROSS=0;
        }
      if (pEMA10>cEMA40 && cEMA10<cEMA40)
        {
         Buffer5[pos]=cEMA10; // falling cross
         dCROSS=0;
        }

      if (pSAR<cEMA40 && cSAR>cEMA40) Buffer4[pos]=cEMA40; //rising SAR/EMA40 cross
      if (pSAR>cEMA40 && cSAR<cEMA40) Buffer8[pos]=cEMA40; //falling SAR/EMA40 cross

      if (cSAR>High[pos]) above++;  // count how long SAR has been up
      if (cSAR<Low[pos])  below++;  // count how long SAR has been down

      if (pSAR<cSAR && cSAR>=High[pos])
        {
         Buffer2[pos]=cSAR;                             // rising SAR
         if (below<=7 && dCROSS>=7) Buffer3[pos]=cSAR;  // Box Indicator RED
         above=0;
         below=0;
        }

      if (pSAR>cSAR && cSAR<=Low[pos])
        {
         Buffer6[pos]=cSAR;                             // falling SAR
         if (above<=7 && dCROSS>=7) Buffer7[pos]=cSAR;  // Box Indicator WHITE
         above=0;
         below=0;
        }

      dCROSS++;                            // distance from any cross

 	   pos--;
     }

   return(0);
  }
//+------------------------------------------------------------------+
Comments