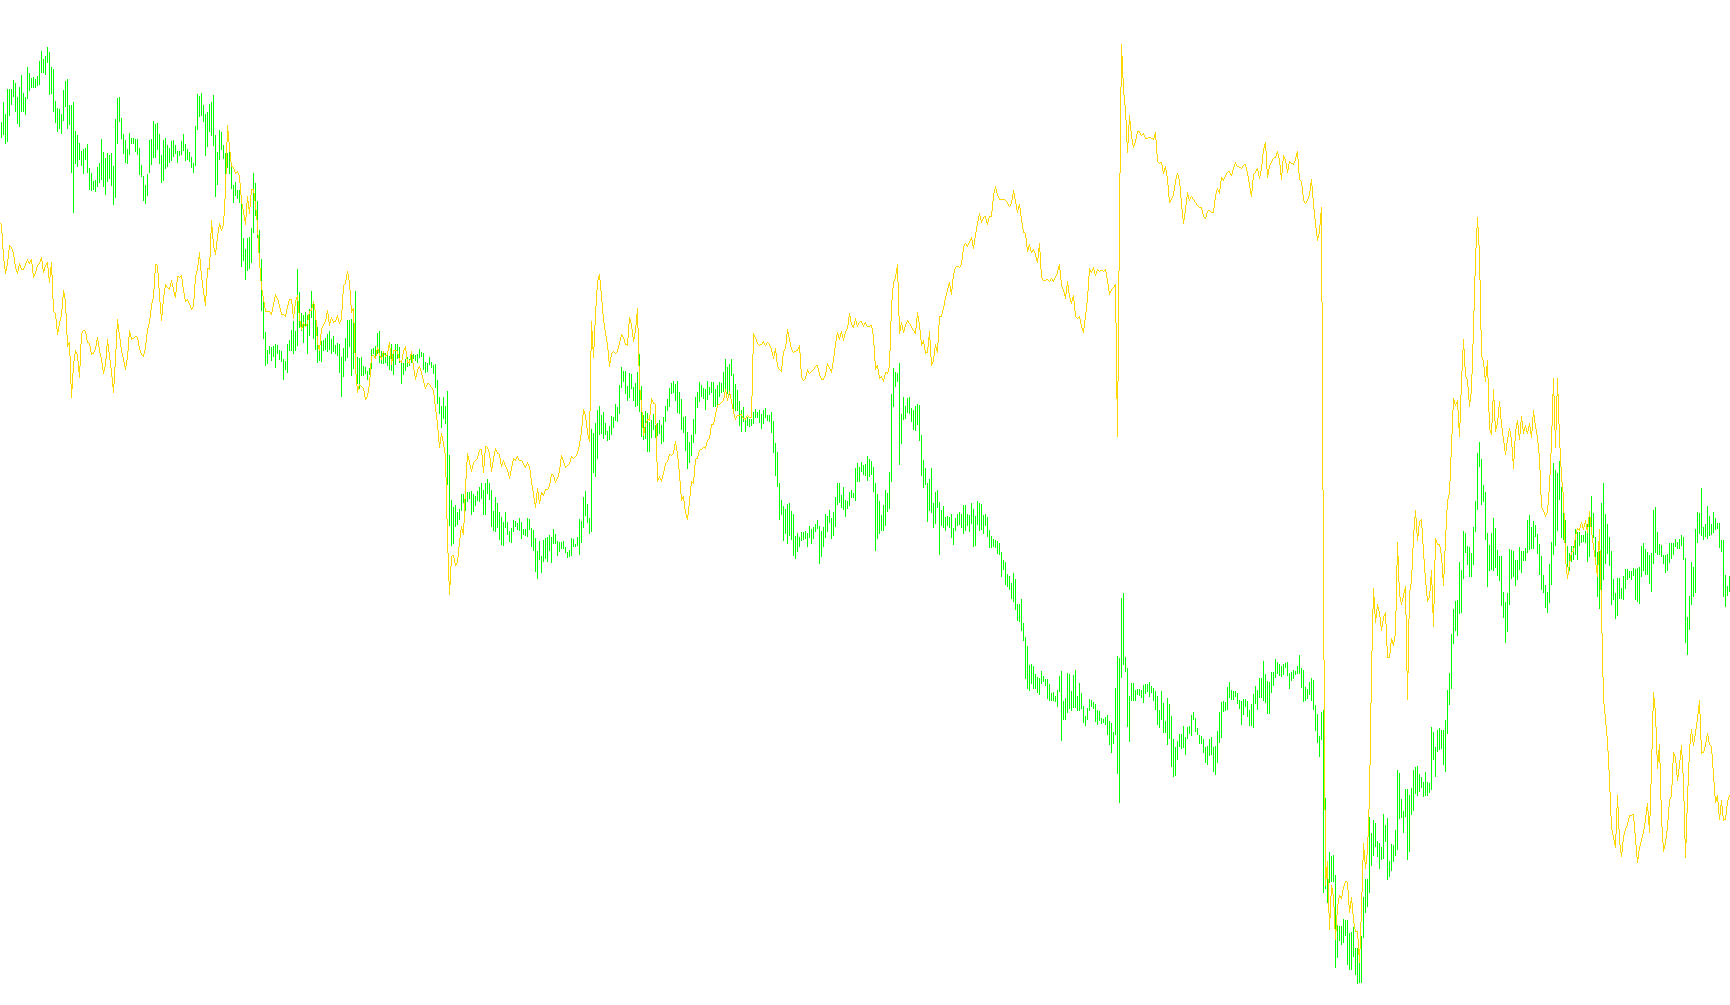
This tool is designed to help traders visualize the flow of money into and out of a financial asset by calculating "Accumulation and Distribution." While price movements on a chart show you where the market has been, this indicator attempts to reveal the underlying pressure behind those moves by analyzing how volume relates to price action.
How the Logic Works
The script processes every historical candle on your chart and performs a three-step calculation to determine the "strength" of each movement:
1. Measuring Price Positioning For every individual bar, the tool looks at four key points: the highest price, the lowest price, the opening price, and the closing price. It specifically calculates where the price ended relative to its total range for that period. If a candle closes near its high, it suggests buying pressure; if it closes near its low, it suggests selling pressure.
2. Calculating the Relative Intensity The script then determines the "weight" of that movement. It compares the distance from the low to the close against the distance from the high to the close. By dividing this relative position by the total range of the candle, the tool creates a percentage-based score of how "bullish" or "bearish" that specific candle was.
3. Factoring in Market Volume A price movement alone doesn't tell the whole story—a small move on low volume is often less significant than a large move on high volume. The script multiplies the percentage score from the previous step by the actual trading volume of that period. This ensures that the indicator gives more weight to movements backed by heavy participation and less weight to insignificant fluctuations.
4. Creating a Cumulative Flow Instead of showing these values as isolated spikes, the logic adds each new calculation to the sum of all previous calculations. This creates a continuous, flowing line (the Accumulation/Distribution line).
What this means for the user
By viewing this cumulative line, you can see the "running total" of buying and selling pressure. When the line trends upward, it indicates that buyers are aggressively accumulating the asset. When it trends downward, it suggests that distribution is taking place as sellers dominate the flow. It acts as a secondary confirmation tool to help determine if a price trend is being supported by real volume or if it is losing momentum.
//+------------------------------------------------------------------+
//|                                                 Accumulation.mq4 |
//|                      Copyright © 2005, MetaQuotes Software Corp. |
//|                                       http://www.metaquotes.net/ |
//+------------------------------------------------------------------+
#property copyright "Copyright © 2005, MetaQuotes Software Corp."
#property link      "http://www.metaquotes.net/"

#property indicator_separate_window
#property indicator_buffers 1
#property indicator_color1 LightSeaGreen
//---- buffers
double ExtMapBuffer1[];
//+------------------------------------------------------------------+
//| Custom indicator initialization function                         |
//+------------------------------------------------------------------+
int init()
  {
   IndicatorShortName("A/D");
//---- indicators
   SetIndexStyle(0,DRAW_LINE);
   SetIndexBuffer(0,ExtMapBuffer1);
//----
   return(0);
  }
//+------------------------------------------------------------------+
//| Accumulation/Distribution                                        |
//+------------------------------------------------------------------+
int start()
  {
   int i,counted_bars=IndicatorCounted();
//----
   i=Bars-counted_bars-1;
   while(i>=0)
     {
      double high =High[i];
      double low  =Low[i];
      double open =Open[i];
      double close=Close[i];
      ExtMapBuffer1[i]=(close-low)-(high-close);
      if(ExtMapBuffer1[i]!=0)
        {
         double diff=high-low;
         if(0==diff)
            ExtMapBuffer1[i]=0;
         else
           {
            ExtMapBuffer1[i]/=diff;
            ExtMapBuffer1[i]*=Volume[i];
           }
        }
      if(i<Bars-1) ExtMapBuffer1[i]+=ExtMapBuffer1[i+1];
      i--;
     }
//----
   return(0);
  }
//+------------------------------------------------------------------+
Comments