ACD_PV_v1
Download script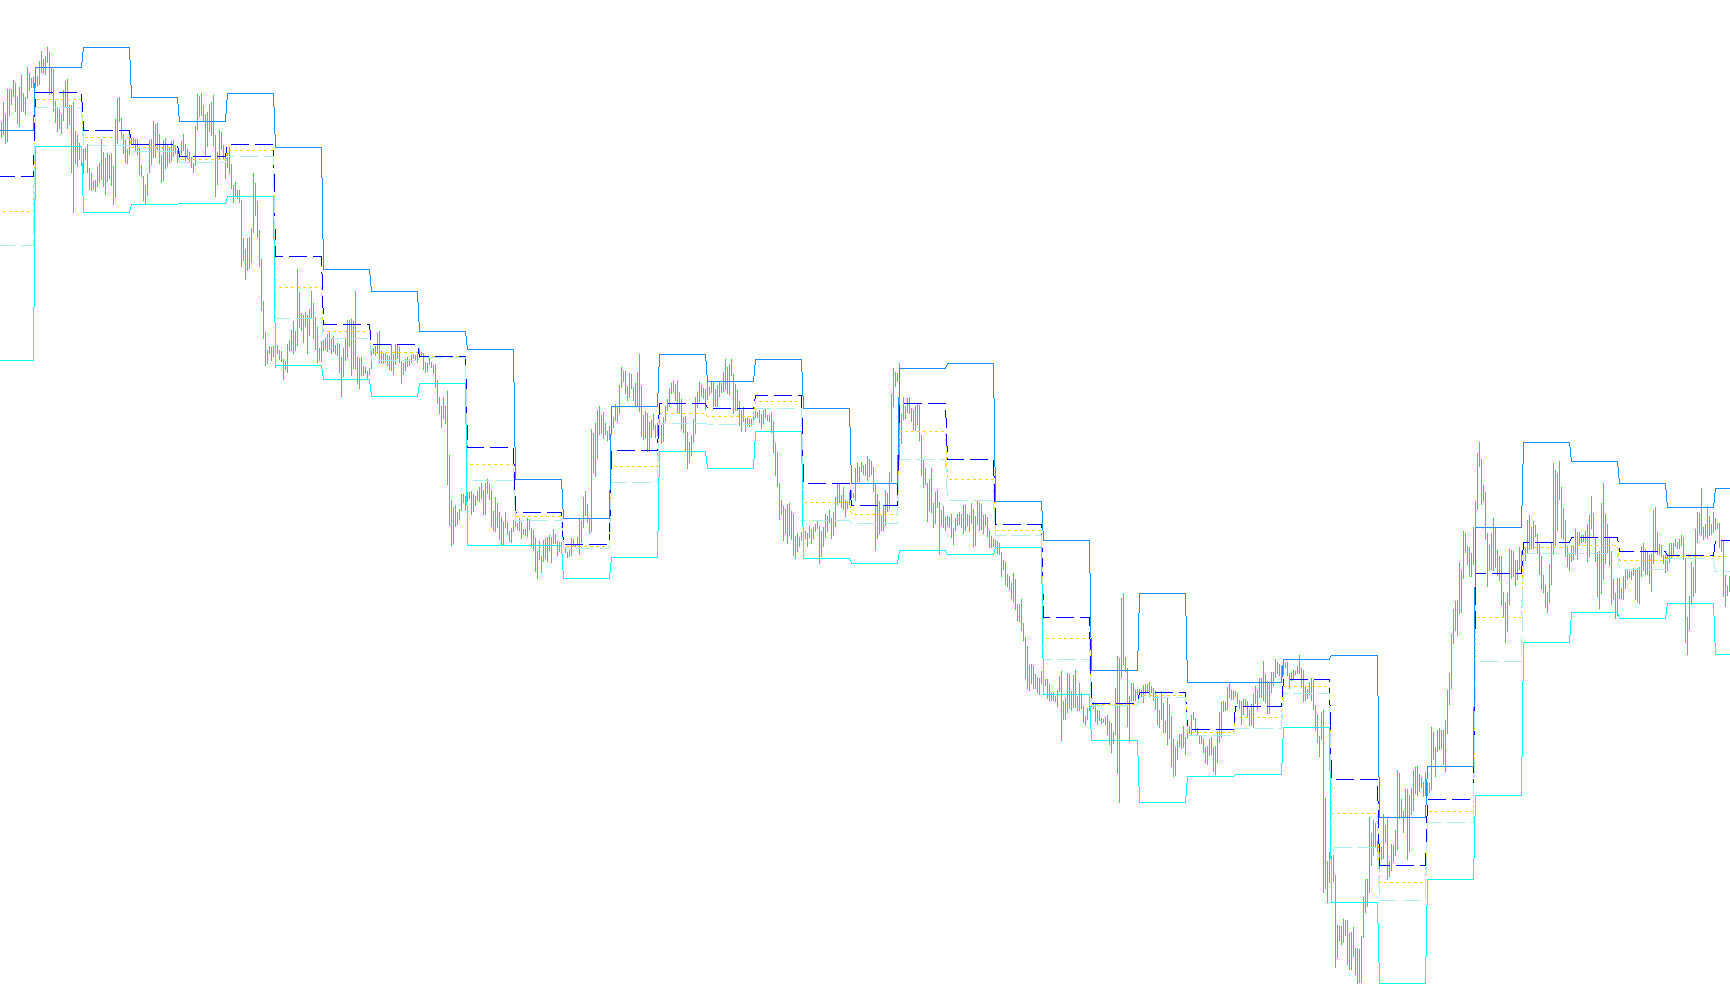
This technical indicator is designed to provide traders with a comprehensive visual map of key market price levels. By analyzing specific historical price action, it identifies "Pivot Points"—significant areas where the market may experience a shift in trend or liquidity—and overlays them onto the chart alongside other vital daily benchmarks.
Core Functionality
The script operates by scanning the market history to identify a specific user-defined time range (the "Pivot Range"). It then performs three primary types of analysis:
1. Pivot Point Calculation During the specified timeframe, the tool identifies the highest price reached, the lowest price reached, and the closing price. It uses these three figures to calculate a central "Pivot Point."
- Dynamic Range: Beyond just finding the center point, the logic calculates a "Pivot Difference" to determine an upper boundary (Top) and a lower boundary (Bottom). This helps traders see the intended "trading zone" for that period.
2. Historical Highs and Lows The indicator tracks and displays the high and low prices from the previous day's trading session. These are essential levels for many trading strategies, as they act as primary support and resistance barriers that often influence price movement throughout the current day.
3. Moving Average Analysis (Optional) For traders who prefer trend-following tools, the script can calculate and display several different Moving Averages (14, 30, and 50 periods) specifically based on the pivot points. Unlike a standard moving average that tracks price, these track the "average of the averages," providing a smoother perspective on where the market's equilibrium is shifting over time.
Visual Elements on the Chart
The indicator translates this data into several distinct visual lines:
- Pivot Point & Range: Displays the calculated center point along with its upper and lower boundaries to define the immediate "area of interest."
- Previous Day Boundaries: Clearly marks where the market peaked and bottomed out in the previous session.
- Trend Lines: If enabled, the script adds standard moving averages to help identify the broader direction of the market.
Summary for the Trader
Essentially, this tool automates the "math" behind price levels. Instead of manually calculating where the market might react based on yesterday's highs or the previous session's range, this script draws those boundaries automatically. It allows you to see at a glance where the market is likely to find support, where it may face resistance, and where the central balance point lies for the current trading period.
/*-----------------------------+
|			       |
| Shared by www.Aptrafx.com    |
|			       |
+------------------------------*/

/**
* ACD_2.mq4
* Pivot Range and Previous High/Low
**/

#property indicator_chart_window
#property indicator_buffers 8
#property indicator_color1 Aqua
#property indicator_color2 Aqua
#property indicator_color3 Aqua
#property indicator_color4 White
#property indicator_color5 White
#property indicator_color6 Red
#property indicator_color7 Blue
#property indicator_color8 Orchid

//Input Params
extern string PivotRangeStart = "00:30";
extern string PivotRangeEnd = "00:30";
extern bool DisplayPivotPoint = true;
extern bool DisplayPreviousHighLow = true;
extern bool DisplayMAs = false;

double Buffer1[];
double Buffer2[];
double Buffer3[];
double Buffer4[];
double Buffer5[];
double Buffer6[];
double Buffer7[];
double Buffer8[];

double pivots[50];

double pivotRangeHigh;
double pivotRangeLow;
double pivotRangeClose;
double pivotPoint;
double pivotDiff;

double pivotTop=0;
double pivotBottom=0;

double pivot14MA;
double pivot30MA;
double pivot50MA;

int openBar;

int init()
{
   SetIndexStyle(0,DRAW_LINE, STYLE_DOT, 1);
   SetIndexBuffer(0,Buffer1);
   SetIndexLabel(0,"Pivot Point");

   SetIndexStyle(1,DRAW_LINE, STYLE_DASH, 1);
   SetIndexBuffer(1,Buffer2);
   SetIndexLabel(1,"Pivot Range Top");

   SetIndexStyle(2,DRAW_LINE, STYLE_DASH, 1);
   SetIndexBuffer(2,Buffer3);
   SetIndexLabel(2,"Pivot Range Bottom");

   SetIndexStyle(3,DRAW_LINE, STYLE_SOLID, 1);
   SetIndexBuffer(3,Buffer4);
   SetIndexLabel(3,"Previous Day High");

   SetIndexStyle(4,DRAW_LINE, STYLE_SOLID, 1);
   SetIndexBuffer(4,Buffer5);
   SetIndexLabel(4,"Previous Day Low");

   SetIndexStyle(5,DRAW_LINE);
   SetIndexBuffer(5,Buffer6);
   SetIndexLabel(5,"14 MA");

   SetIndexStyle(6,DRAW_LINE);
   SetIndexBuffer(6,Buffer7);
   SetIndexLabel(6,"30 MA");

   SetIndexStyle(7,DRAW_LINE);
   SetIndexBuffer(7,Buffer8);
   SetIndexLabel(7,"50 MA");

   return(0);
}

int deinit()
{
   return(0);
}

int start()
{
   string barTime="", lastBarTime="";
   string barDay="", lastBarDay="";
   int closeBar;

   for(int i=Bars; i>=0; i--)
   {
      barTime = TimeToStr(Time[i], TIME_MINUTES);
      lastBarTime = TimeToStr(Time[i+1], TIME_MINUTES);
      barDay = TimeToStr(Time[i],TIME_DATE);
      lastBarDay = TimeToStr(Time[i+1],TIME_DATE);

      //need to handle if pivotrangestart/end is 00:00
      if ((PivotRangeEnd == "00:00" && barTime>=PivotRangeEnd && barDay>lastBarDay) || (barTime>=PivotRangeEnd && lastBarTime<PivotRangeEnd))
      {
         closeBar = i + 1;

         if (openBar>0)
         {
            calculatePivotRangeValues(openBar, closeBar);
         }
      }

      if ((PivotRangeStart == "00:00" && barTime>=PivotRangeStart && barDay>lastBarDay) || (barTime>=PivotRangeStart && lastBarTime<PivotRangeStart))
      {
          openBar = i;
      }

      if (openBar>0)
      {
          drawIndicators(i);
      }
   }
   return(0);
}

void calculatePivotRangeValues(int openBar, int closeBar)
{
   pivotRangeHigh = High[Highest(NULL, 0, MODE_HIGH, (openBar - closeBar + 1), closeBar)];
   pivotRangeLow = Low[Lowest(NULL, 0, MODE_LOW, (openBar - closeBar + 1), closeBar)];
   pivotRangeClose = Close[closeBar];
   pivotPoint = (pivotRangeHigh + pivotRangeLow + pivotRangeClose)/3;
   pivotDiff = MathAbs(((pivotRangeHigh + pivotRangeLow)/2) - pivotPoint);
   pivotTop = pivotPoint + pivotDiff;
   pivotBottom = pivotPoint - pivotDiff;

   if (DisplayMAs) calcPivotMA();
}

void calcPivotMA()
{
   //create temp array
   double pivs[50];

   //load new pivot
   ArrayCopy(pivs,pivots,1,0,49);
   pivs[0] = pivotPoint;
   ArrayCopy(pivots, pivs, 0, 0, WHOLE_ARRAY);

   //calcMA
   double pivSum = 0;
   int count = ArraySize(pivots);
   if (count>=14)
   {
      for (int p=0; p<count; p++)
      {
         pivSum+=pivots[p];

         if (p==13)
         {
            pivot14MA = pivSum/14;
         }

         if (p==29)
         {pivot30MA = pivSum/30;}

         if (p==49)
         {pivot50MA = pivSum/50;}
      }
   }
}

void drawIndicators(int curBar)
{
   if (DisplayPivotPoint) Buffer1[curBar]=pivotPoint;

   Buffer2[curBar]=pivotTop;
   Buffer3[curBar]=pivotBottom;

   if (DisplayPreviousHighLow)
   {
      Buffer4[curBar]=pivotRangeHigh;
      Buffer5[curBar]=pivotRangeLow;
   }

   if (DisplayMAs)
   {
      Buffer6[curBar]=pivot14MA;
      Buffer7[curBar]=pivot30MA;
      Buffer8[curBar]=pivot50MA;
   }


}
Comments