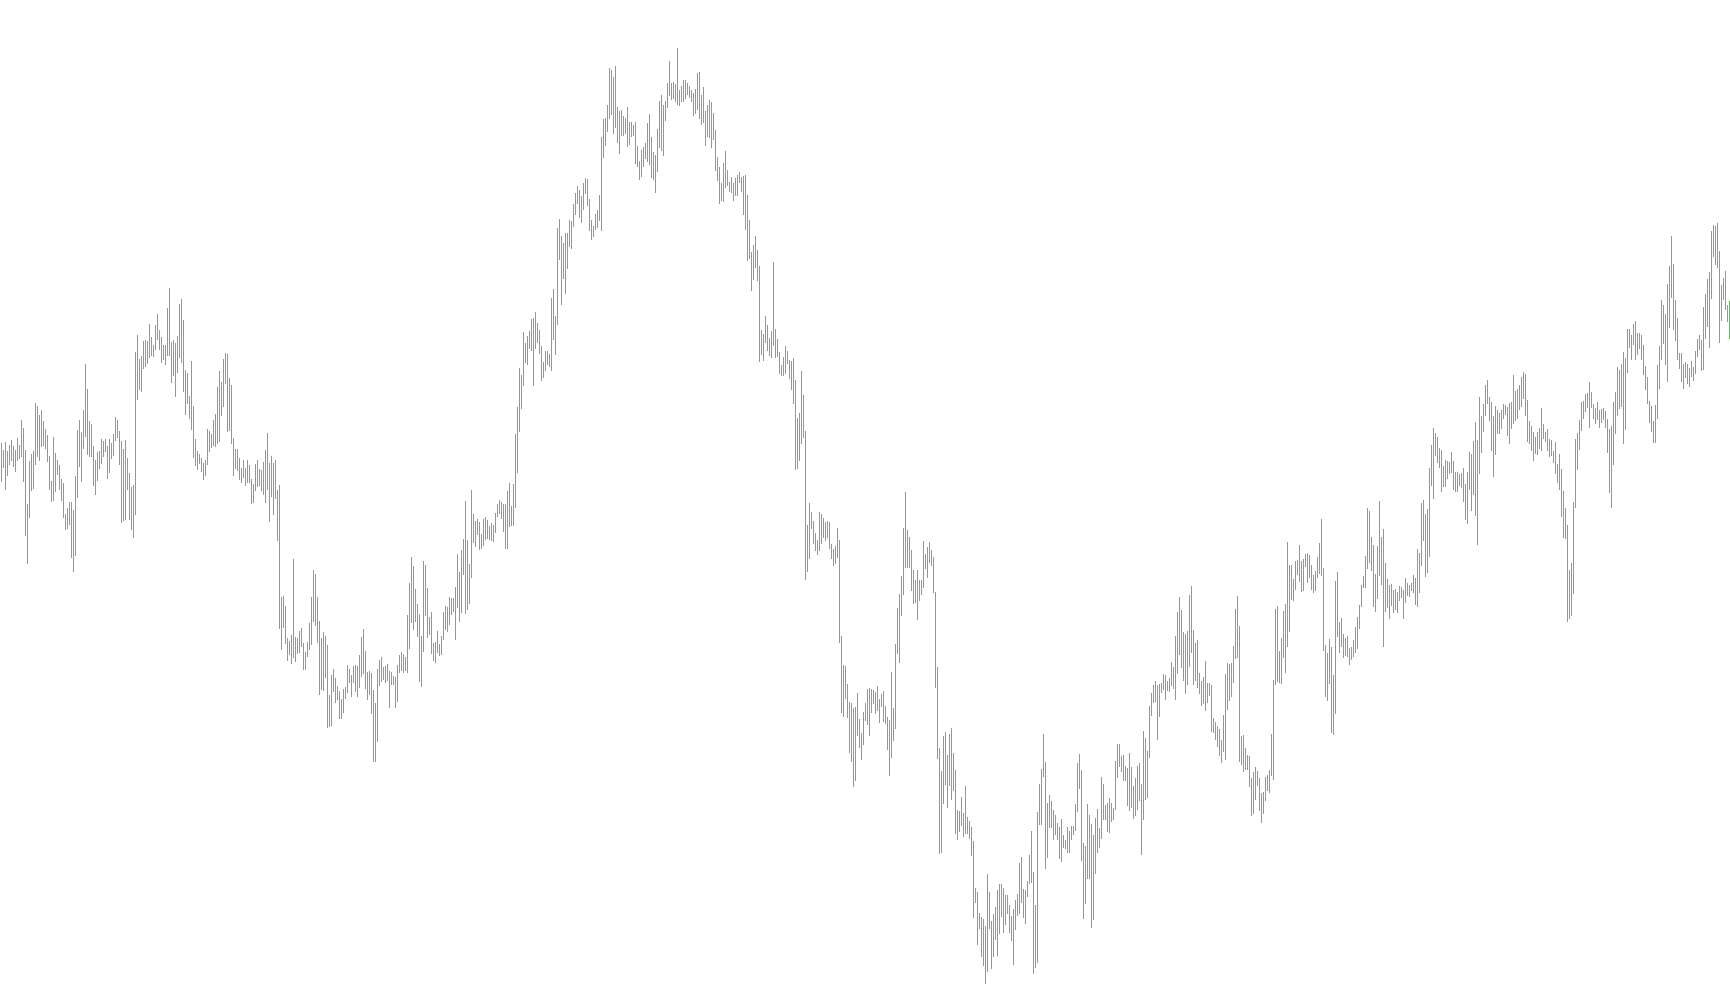
This tool is a specialized technical indicator designed to measure the strength and direction of market trends. Unlike standard indicators that might only show you what price is doing, this script analyzes the "momentum" by identifying which way the market is moving more aggressively—upward or downward—and calculating the intensity of those movements.
How the Logic Works
The script processes market data through several distinct stages to arrive at a final reading:
1. Identifying Movement (Directional Movement) First, the tool looks at the relationship between the current price bar and the previous one. It calculates two specific values:
- Positive Movement: How much the price pushed higher compared to the previous candle.
- Negative Movement: How much the price pushed lower compared to the previous candle.
The logic includes a "filter" here: if the upward push is weaker than the downward push (or vice versa), it ignores the weaker movement. If both movements are equal, it treats them as neutral. This ensures that only the dominant direction of the price action is captured.
2. Normalizing the Data To make these movements comparable, the script calculates the "True Range." This represents the total volatility of a candle (the distance between the highest high and lowest low). By comparing the directional movement against this true range, the tool creates a percentage-based score for both upward and downward pressure.
3. Smoothing the Data Raw market data can be very "noisy" and jumpy. To provide a cleaner picture for the user, the script applies an Exponential Moving Average (EMA) to both the upward and downward scores. This smoothing helps filter out minor price fluctuations so that only sustained trends remain visible.
4. Calculating Strength (ADX) Finally, the tool combines the smoothed upward and downward components to determine two final outputs:
- The Difference: It calculates the spread between the upward and downward forces.
- The ADX Value: The script takes that difference and applies one final smoothing pass.
What This Means for the User
The resulting visual output provides a clear view of market dynamics:
- It shows you the relative strength of buyers versus sellers (the +DI and -DI lines).
- It provides an overall "Trend Strength" index (the ADX line), which tells you how powerful the current trend is, regardless of whether the price is going up or down. If the trend strength is high, it suggests a strong move is underway; if it is low, the market may be moving sideways or in a state of equilibrium.
//+------------------------------------------------------------------+
//|                                              ADX modified_v2.mq4 |
//|                      Copyright © 2004, MetaQuotes Software Corp. |
//|                                       http://www.metaquotes.net/ |
//|                                                                  |
//|                               Modified from default ADX by Toshi |
//|                                  http://toshi52583.blogspot.com/ |
//+------------------------------------------------------------------+
#property copyright "Copyright © 2004, MetaQuotes Software Corp."
#property link      "http://www.metaquotes.net/"

#property indicator_separate_window
#property indicator_buffers 3
#property indicator_color1 C'175,175,175'
#property indicator_color2 C'175,0,0'
#property indicator_style2 2
#property indicator_color3 C'100,100,100'
#property indicator_style3 2
#property indicator_level1 50
#property indicator_level2 0
#property indicator_level3 -50
#property indicator_levelcolor C'75,75,75'
//---- input parameters
extern int ADXPeriod=14;
//---- buffers
double ADXBuffer[];
double PlusDiBuffer[];
double MinusDiBuffer[];
double PlusSdiBuffer[];
double MinusSdiBuffer[];
double TempBuffer[];
//+------------------------------------------------------------------+
//| Custom indicator initialization function                         |
//+------------------------------------------------------------------+
int init()
  {
//---- 3 additional buffers are used for counting.
   IndicatorBuffers(6);
//---- indicator buffers
   SetIndexBuffer(0,ADXBuffer);
   SetIndexBuffer(1,PlusDiBuffer);
   SetIndexBuffer(2,MinusDiBuffer);
   SetIndexBuffer(3,PlusSdiBuffer);
   SetIndexBuffer(4,MinusSdiBuffer);
   SetIndexBuffer(5,TempBuffer);
//---- name for DataWindow and indicator subwindow label
   IndicatorShortName("ADX modified("+ADXPeriod+")");
   SetIndexLabel(0,"ADX modified");
   SetIndexLabel(1,"+DI");
   SetIndexLabel(2,"-DI");
//----
   SetIndexDrawBegin(0,ADXPeriod);
   SetIndexDrawBegin(1,ADXPeriod);
   SetIndexDrawBegin(2,ADXPeriod);
//----
   return(0);
  }
//+------------------------------------------------------------------+
//| Average Directional Movement Index                               |
//+------------------------------------------------------------------+
int start()
  {
   double pdm,mdm,tr;
   double price_high,price_low;
   int    starti,i,counted_bars=IndicatorCounted();
//----
   i=Bars-2;
   PlusSdiBuffer[i+1]=0;
   MinusSdiBuffer[i+1]=0;
   if(counted_bars>=i) i=Bars-counted_bars-1;
   starti=i;
//----
   while(i>=0)
     {
      price_low=Low[i];
      price_high=High[i];
      //----
      pdm=price_high-High[i+1];
      mdm=Low[i+1]-price_low;
      if(pdm<0) pdm=0;  // +DM
      if(mdm<0) mdm=0;  // -DM
      if(pdm==mdm) { pdm=0; mdm=0; }
      else if(pdm<mdm) pdm=0;
           else if(mdm<pdm) mdm=0;
      //---- âû÷èñëÿåì èñòèííûé èíòåðâàë
      double num1=MathAbs(price_high-price_low);
      double num2=MathAbs(price_high-Close[i+1]);
      double num3=MathAbs(price_low-Close[i+1]);
      tr=MathMax(num1,num2);
      tr=MathMax(tr,num3);
      //---- counting plus/minus direction
      if(tr==0) { PlusSdiBuffer[i]=0; MinusSdiBuffer[i]=0; }
      else      { PlusSdiBuffer[i]=100.0*pdm/tr; MinusSdiBuffer[i]=100.0*mdm/tr; }
      //----
      i--;
     }
//---- last counted bar will be recounted
   if(counted_bars>0) counted_bars--;
   int limit=Bars-counted_bars;
//---- apply EMA to +DI
   for(i=0; i<=limit; i++)
      PlusDiBuffer[i]=iMAOnArray(PlusSdiBuffer,Bars,ADXPeriod,0,MODE_EMA,i);
//---- apply EMA to -DI
   for(i=0; i<=limit; i++)
      MinusDiBuffer[i]=iMAOnArray(MinusSdiBuffer,Bars,ADXPeriod,0,MODE_EMA,i);
//---- Directional Movement (DX)
   for(i=0; i<=limit; i++)
      TempBuffer[i]=(PlusDiBuffer[i]-MinusDiBuffer[i])*3;
//---- ADX is exponential moving average on DX
   for(i=0; i<limit; i++)
      ADXBuffer[i]=iMAOnArray(TempBuffer,Bars,ADXPeriod,0,MODE_EMA,i);
//----
   return(0);
  }
//+------------------------------------------------------------------+
Comments