aNina_v1
Download script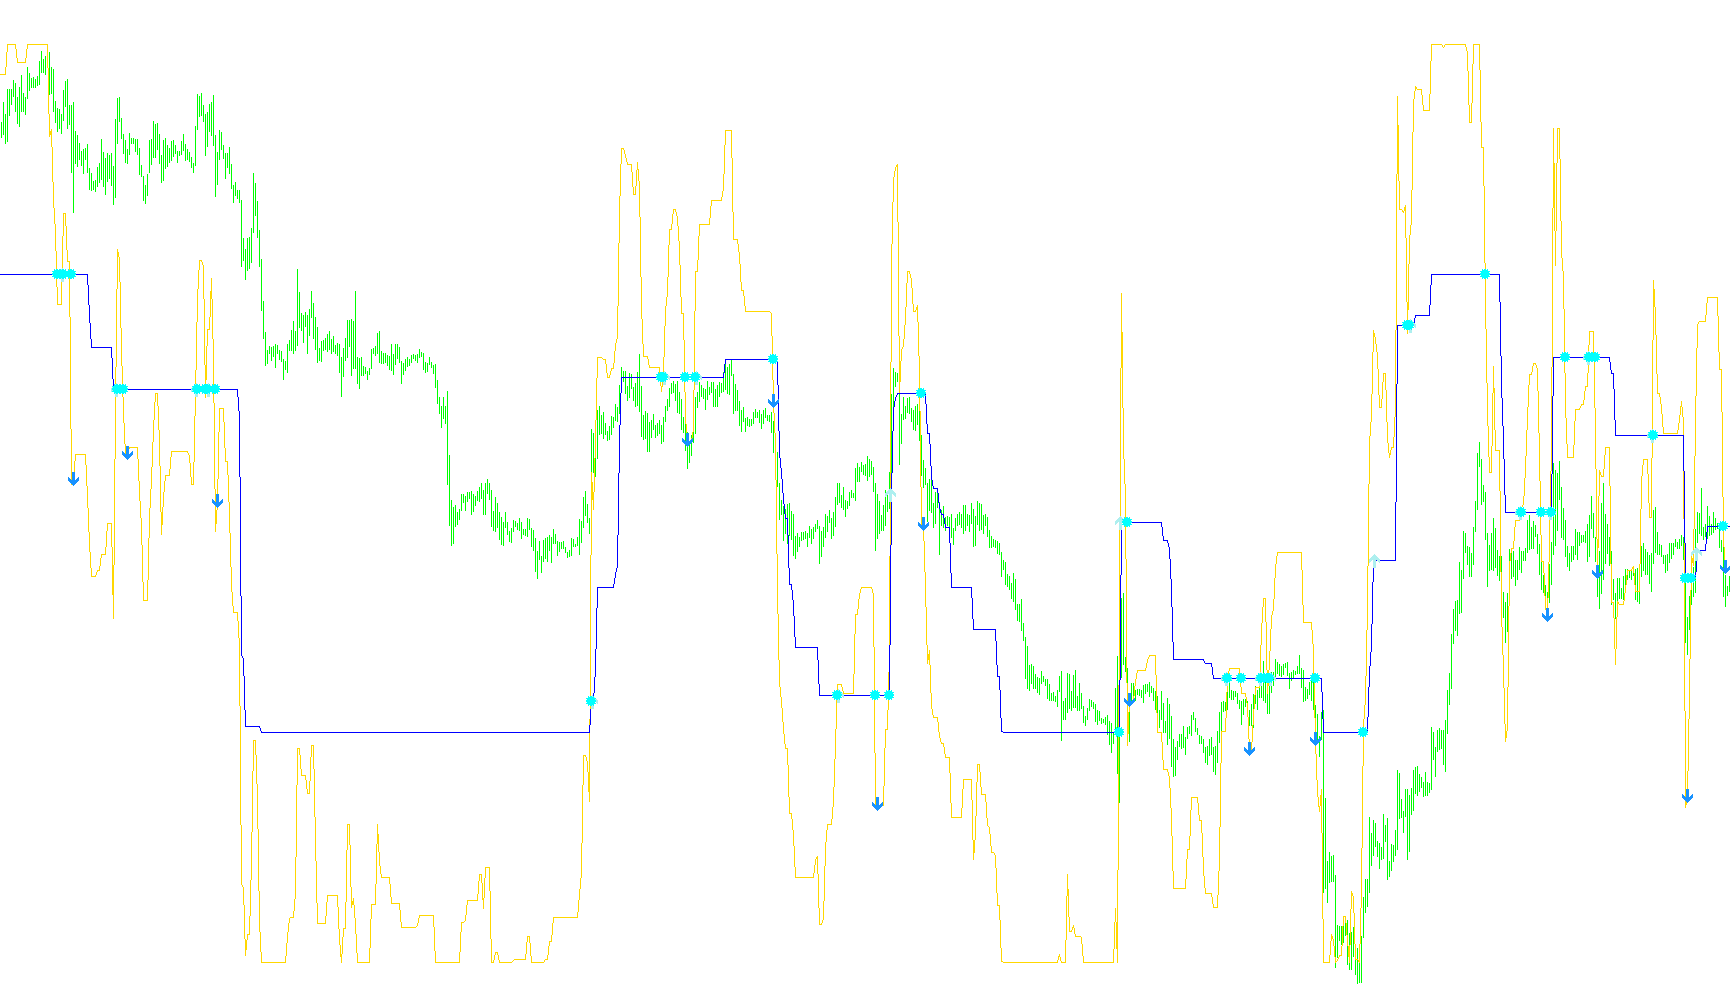
Overview of the Trading Logic
This script functions as a momentum and trend-following indicator designed to identify specific price action patterns, volatility extremes, and potential entry or exit points. It translates complex market movements into a visual representation that helps traders distinguish between high-probability trends and noise.
Core Mechanics and Calculations
1. Volatility Measurement (WATR) The script begins by calculating a dynamic range of the market. Unlike standard indicators that look at fixed price points, this logic uses a weighted calculation over a specific number of bars. It measures the absolute difference between highs and lows, giving more importance to recent price action. This creates a "volatility envelope" that adjusts automatically as the market becomes more or less active.
2. Dynamic Boundary Detection Using the volatility data calculated above, the script establishes three distinct levels of activity:
- Minimum Range: Represents low-intensity movement.
- Maximum Range: Represents high-intensity movement.
- Mid Range: Represents the balanced center of market activity.
The script monitors whether current price action is breaking out of these boundaries or staying within them, creating a "memory" of previous trends to ensure it doesn't react to insignificant price fluctuations.
3. Momentum Scoring (Stochastic-Style Calculation) The script converts these dynamic boundaries into two specific momentum lines (Line Min and Line Mid). These lines are normalized into a scale (similar to a Stochastic Oscillator). By comparing the current price position relative to the high/low boundaries of recent history, it produces a value that indicates whether the market is overextended or gaining strength.
Signal Generation Logic
The primary goal of this script is to identify "crosses" and "trends." Here is how it interprets the data:
- The Cross Mechanism: The indicator looks for moments where the momentum lines (Min and Mid) flip positions relative to each other. A crossover between these lines is treated as a potential shift in market sentiment.
- Trend Verification: To filter out "fake" signals, the script cross-references the momentum lines with a 50-period Exponential Moving Average (EMA). This serves as a long-term trend filter.
- Buy/Sell Identification:
- Buy Signals: Triggered when the momentum lines cross in a specific direction while the price is positioned favorably relative to the 50-period EMA. It specifically looks for instances where the market shows upward momentum while the price is still "submerged" or recovering near the moving average.
- Sell Signals: Mirror this logic, identifying downward momentum shifts when the price is positioned above the moving average.
- Signal Quality: The logic includes a specific check to identify "Very Good Signals." These occur when the crossover happens in close proximity to the Moving Average (within a specific point range), suggesting a high-probability reversal or continuation.
Summary of Visual Output
The script provides a multi-layered visual experience:
- Continuous Lines: Represent the smoothed momentum and the moving average trends.
- Arrows: These act as the primary "action" markers, indicating where the logic has identified a validated Buy, Sell, or Exit point based on the interaction between volatility, momentum crossovers, and long-term trend filters.
#property indicator_separate_window
#property indicator_buffers 5
#property indicator_color1 Yellow
#property indicator_color2 DeepSkyBlue
#property indicator_color3 Green
#property indicator_color4 Red
#property indicator_color5 Blue

#property indicator_minimum 0
#property indicator_maximum 1
//---- input parameters
extern int PeriodWATR=10;
extern double Kwatr=1.0000;
extern int HighLow=0;
extern int cbars = 0;
extern int from  = 0;
extern int maP  = 50;


//---- indicator buffers
double LineMinBuffer[];
double LineMidBuffer[];
double LineBuyBuffer[];
double LineSellBuffer[];
double LineExitBuffer[];
double Ma50[];
//+------------------------------------------------------------------+
//| Custom indicator initialization function                         |
//+------------------------------------------------------------------+
  int init()
  {
   string short_name;
   IndicatorBuffers(6);
//---- indicator line
   SetIndexStyle(0,DRAW_LINE,STYLE_SOLID,1);
   SetIndexStyle(1,DRAW_LINE,STYLE_SOLID,1);
   SetIndexStyle(2,DRAW_ARROW,STYLE_SOLID,1);
   SetIndexStyle(3,DRAW_ARROW,STYLE_SOLID,1);
   SetIndexStyle(4,DRAW_ARROW);

   SetIndexStyle(5,DRAW_NONE);
   SetIndexEmptyValue(5,0);

   SetIndexEmptyValue(2,0);
   SetIndexArrow(2,233);
   SetIndexEmptyValue(3,0);
   SetIndexArrow(3,234);
   SetIndexEmptyValue(4,0);
   SetIndexArrow(4,174);


   SetIndexBuffer(0,LineMinBuffer);
   SetIndexBuffer(1,LineMidBuffer);
   SetIndexBuffer(2,LineBuyBuffer);
   SetIndexBuffer(3,LineSellBuffer);
   SetIndexBuffer(4,LineExitBuffer);
   SetIndexBuffer(5,Ma50);

   IndicatorDigits(MarketInfo(Symbol(),MODE_DIGITS));
//---- name for DataWindow and indicator subwindow label
   short_name="Nina("+PeriodWATR+","+Kwatr+","+HighLow+")";
   IndicatorShortName(short_name);
//----
   SetIndexDrawBegin(0,PeriodWATR);
   SetIndexDrawBegin(1,PeriodWATR);

//----
   return(0);
  }

int last_update = 0;
int last = 0;

int start(){
   if(last==Bars) return (0);
   last = Bars;

   int limit = cbars;

   if(limit==0 || limit>Bars) limit = Bars;
   //last_update = Bars;

   int      i,shift,TrendMin,TrendMax,TrendMid;
   double   SminMin0,SmaxMin0,SminMin1,SmaxMin1,SumRange,dK,WATR0,WATRmax,WATRmin,WATRmid;
   double   SminMax0,SmaxMax0,SminMax1,SmaxMax1,SminMid0,SmaxMid0,SminMid1,SmaxMid1;
   double   linemin,linemax,linemid,Stoch1,Stoch2,bsmin,bsmax;

   int StepSizeMin,StepSizeMax,StepSizeMid;
   double min,max,mid,h,l,c;

   int b = 0;
   int last = 0,ma = 0,last_ma = 0;
   //ArrayInitialize(Ma50,0);
   //ArrayInitialize(LineBuyBuffer,0);
   //ArrayInitialize(LineSellBuffer,0);
   Print(limit);

   for(shift=limit-1;shift>=from;shift--){
	  SumRange=0;
	  for (i=PeriodWATR-1;i>=from;i--){
         dK = 1+1.0*(PeriodWATR-i)/PeriodWATR;
         SumRange+= dK*MathAbs(High[i+shift]-Low[i+shift]);
         }
	  WATR0 = SumRange/PeriodWATR;

	  WATRmax=MathMax(WATR0,WATRmax);
	  if (shift==limit-1-PeriodWATR) WATRmin=WATR0;
	  WATRmin=MathMin(WATR0,WATRmin);

	  StepSizeMin=MathRound(Kwatr*WATRmin/Point);
	  StepSizeMax=MathRound(Kwatr*WATRmax/Point);
	  StepSizeMid=MathRound(Kwatr*0.5*(WATRmax+WATRmin)/Point);

     min = Kwatr*WATRmin;
     max = Kwatr*WATRmax;
     mid = Kwatr*0.5*(WATRmax+WATRmin);

	  //b = iBarShift(Symbol(),tPeriod,Time[shift]);
	  c = Close[shift];//iClose(Symbol(),tPeriod,b);
	  h = High[shift];//iHigh(Symbol(),tPeriod,b)
	  l = Low[shift];//iLow(Symbol(),tPeriod,b)

	  if (HighLow>0){
	    SmaxMin0=l+2*min;
	    SminMin0=h-2*min;

	    SmaxMax0=l+2*max;
	    SminMax0=h-2*max;

	    SmaxMid0=l+2*mid;
	    SminMid0=h-2*mid;

	    if(c>SmaxMin1) TrendMin=1;
	    if(c<SminMin1) TrendMin=-1;

	    if(c>SmaxMax1) TrendMax=1;
	    if(c<SminMax1) TrendMax=-1;

	    if(c>SmaxMid1) TrendMid=1;
	    if(c<SminMid1) TrendMid=-1;
	    }

	  if (HighLow == 0){
	    SmaxMin0=c+2*min;
	    SminMin0=c-2*min;

	    SmaxMax0=c+2*max;
	    SminMax0=c-2*max;

	    SmaxMid0=c+2*mid;
	    SminMid0=c-2*mid;

	    if(c>SmaxMin1) TrendMin=1;
	    if(c<SminMin1) TrendMin=-1;

	    if(c>SmaxMax1) TrendMax=1;
	    if(c<SminMax1) TrendMax=-1;

	    if(c>SmaxMid1) TrendMid=1;
	    if(c<SminMid1) TrendMid=-1;
	    }

	  if(TrendMin>0 && SminMin0<SminMin1) SminMin0=SminMin1;
	  if(TrendMin<0 && SmaxMin0>SmaxMin1) SmaxMin0=SmaxMin1;

	  if(TrendMax>0 && SminMax0<SminMax1) SminMax0=SminMax1;
	  if(TrendMax<0 && SmaxMax0>SmaxMax1) SmaxMax0=SmaxMax1;

	  if(TrendMid>0 && SminMid0<SminMid1) SminMid0=SminMid1;
	  if(TrendMid<0 && SmaxMid0>SmaxMid1) SmaxMid0=SmaxMid1;


	  if (TrendMin>0) linemin=SminMin0+min;
	  if (TrendMin<0) linemin=SmaxMin0-min;

	  if (TrendMax>0) linemax=SminMax0+max;
	  if (TrendMax<0) linemax=SmaxMax0-max;

	  if (TrendMid>0) linemid=SminMid0+mid;
	  if (TrendMid<0) linemid=SmaxMid0-mid;

	  bsmin=linemax-max;
	  bsmax=linemax+max;
	  Stoch1=(linemin-bsmin)/(bsmax-bsmin);
	  Stoch2=(linemid-bsmin)/(bsmax-bsmin);

	  LineMinBuffer[shift]=Stoch1;
	  LineMidBuffer[shift]=Stoch2;


	  SminMin1=SminMin0;
	  SmaxMin1=SmaxMin0;

	  SminMax1=SminMax0;
	  SmaxMax1=SmaxMax0;

	  SminMid1=SminMid0;
	  SmaxMid1=SmaxMid0;

     Ma50[shift] = iMA(NULL,0,50,0,MODE_EMA,PRICE_CLOSE,shift);
     if(is_inside(shift)) last_ma = shift;

	  if(
	     is_cross(shift)
	     ){
	     last = 0;
	     LineExitBuffer[shift] = LineMidBuffer[shift];
	     // BUY or SELL
        if(LineMinBuffer[shift]-LineMidBuffer[shift]>0){
            if(/*last_ma == shift || */(last_ma!=0 && Ma50[last_ma]-Open[shift]<0)){
               // VERY GOOD SIGNAL - BEST TRADE
               LineBuyBuffer[shift] = LineMidBuffer[shift];
	            if(last_ma == shift && MathAbs(Ma50[last_ma]-Open[shift])/Point < 20) LineExitBuffer[shift] = LineMidBuffer[shift];
               }
            else if(last_ma!=0){
               last = shift;
               }
            }
        else if(LineMinBuffer[shift]-LineMidBuffer[shift]<0){
            if(/*last_ma == shift || */(last_ma!=0 && Ma50[last_ma]-Open[shift]>0)){
               // VERY GOOD SIGNAL - BEST TRADE
               LineSellBuffer[shift] = LineMinBuffer[shift];
	            if(last_ma == shift && MathAbs(Ma50[last_ma]-Open[shift])/Point < 20) LineExitBuffer[shift] = LineMinBuffer[shift];
               }
            else if(last_ma!=0){
               last = -shift;
               }
            }
	     }
	   else{
	     if(last>0 && Open[shift]-Ma50[shift]>0/* && last_ma==shift+1*/){
	        LineBuyBuffer[shift] = LineMidBuffer[shift];
	        last = 0;
	        }
	     else if(last<0 && Open[shift]-Ma50[shift]<0/* && last_ma==shift+1*/){
	        LineSellBuffer[shift] = LineMinBuffer[shift];
	        last = 0;
	        }
	     }
	   }
	return(0);
 }

bool is_inside(int shift){
   return (
      (Close[shift] - Ma50[shift])*(Open[shift] - Ma50[shift])<0
      //Ma50[shift]>MathMin(Close[shift],Open[shift]) && Ma50[shift]<MathMax(Close[shift],Open[shift])
      );
}

bool is_cross(int shift){
   return
      (
      (LineMinBuffer[shift]-LineMidBuffer[shift])*(LineMinBuffer[shift+1]-LineMidBuffer[shift+1])<0
      //|| (LineMinBuffer[shift+1]-LineMidBuffer[shift+1]==0 && LineMinBuffer[shift]-LineMidBuffer[shift]!=0)

      //(LineMinBuffer[shift+1]<=0.0 && LineMinBuffer[shift]==0.0 && LineMidBuffer[shift+1]==0.0 && LineMidBuffer[shift]>=0.0) ||
      //(LineMinBuffer[shift+1]==0.0 && LineMinBuffer[shift]<=0.0 && LineMidBuffer[shift+1]>=0.0 && LineMidBuffer[shift]==0.0)
      );
}
Comments