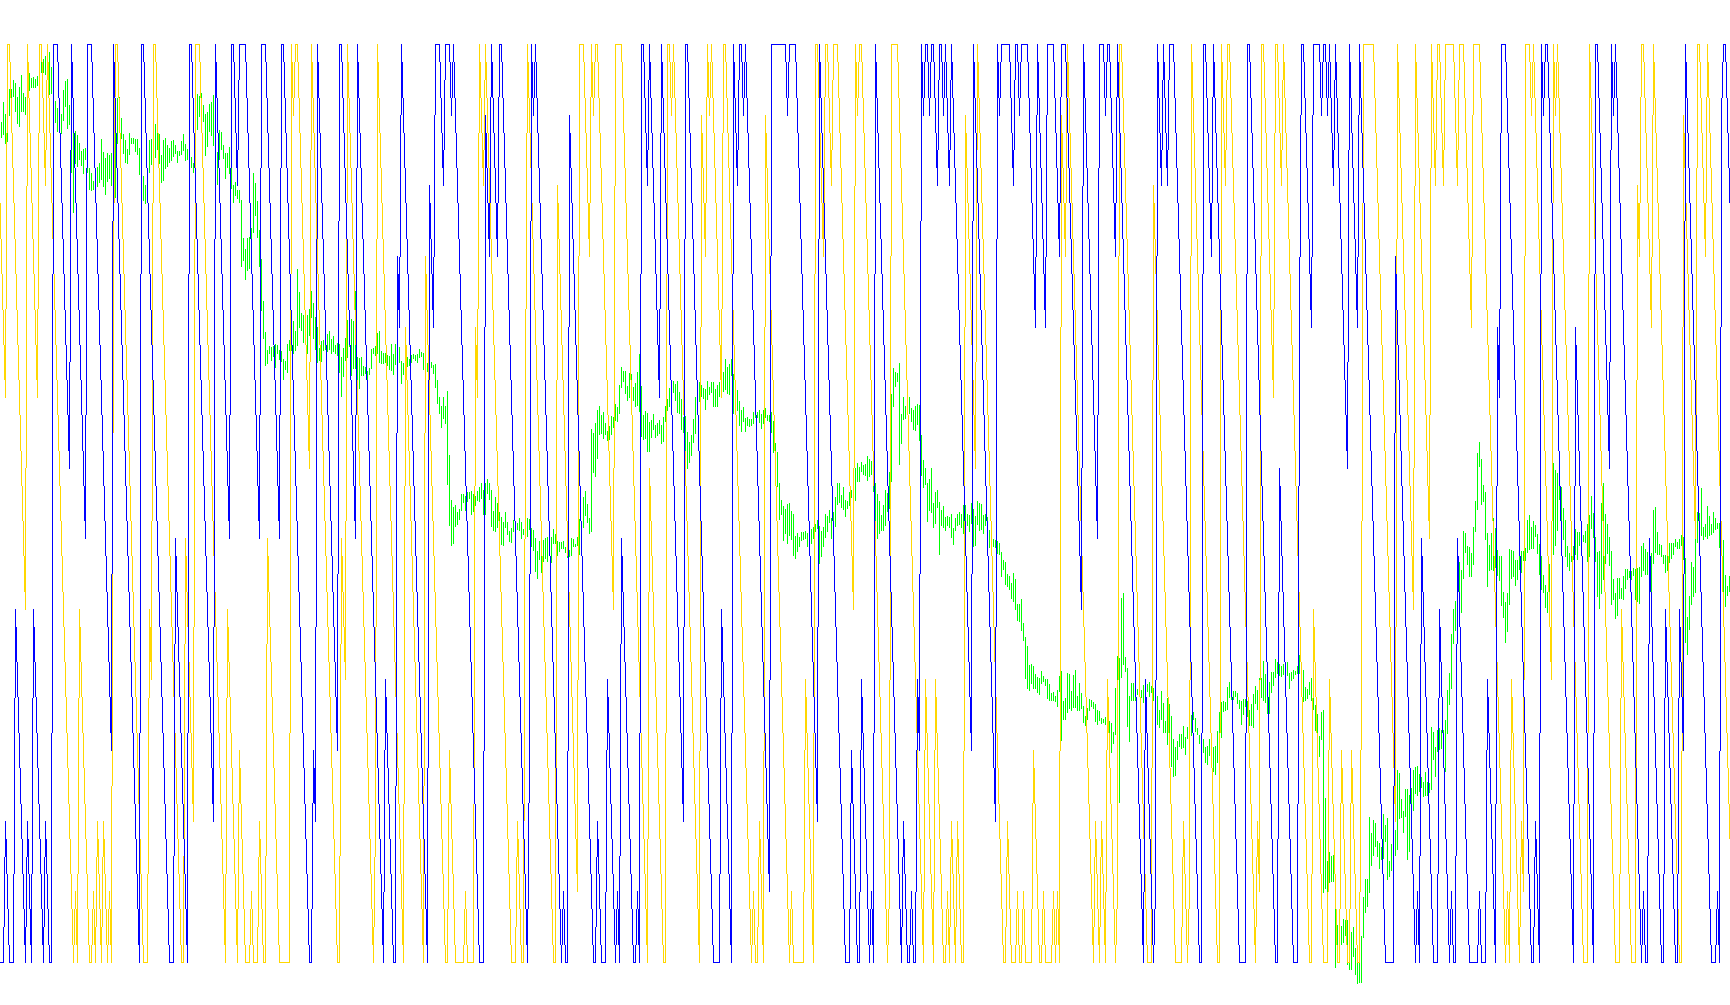
This tool is designed to help traders visualize the strength of a market trend by measuring how recently the price has reached new highs or lows over a specific timeframe. Rather than just looking at where the price is currently, it analyzes the "freshness" of these peaks and valleys to determine if the market is actively moving in a direction or becoming stagnant.
Core Logic Overview
The indicator works by scanning a defined window of time (the period) to identify the most recent significant price points. It then converts the distance between those points and the current moment into a percentage score ranging from 0 to 100.
Key Components of the Calculation
- Identifying Extremes: The script looks back at the last 14 bars (by default) to find two specific values: the highest price reached and the lowest price reached during that interval.
- Measuring Recency: Instead of just noting what the high or low was, the logic calculates when it happened. It measures how many bars ago those extreme prices occurred relative to the current candle.
- Trend Strength Scoring:
- If a new high (or low) was reached very recently (e.g., on the very last candle), the indicator produces a score closer to 100. This suggests strong momentum, as the price is actively pushing toward new boundaries.
- If the highest or lowest point occurred a long time ago at the beginning of the lookback period, the score drops toward 0. This suggests that the trend may be losing steam or becoming exhausted.
Visual Representation
The tool provides two distinct lines on a separate window:
- Upper Momentum Line: Tracks the "freshness" of recent highs. When this line is high, it indicates the bulls (buyers) are actively pushing the price upward.
- Lower Momentum Line: Tracks the "freshness" of recent lows. When this line is high, it indicates the bears (sellers) are aggressively driving the price downward.
By observing these two lines together, users can identify whether a trend is gaining strength, losing momentum, or if the market is entering a period of consolidation where neither side has a clear advantage.
//+------------------------------------------------------------------+
//|                                                     Momentum.mq4 |
//|                      Copyright © 2004, MetaQuotes Software Corp. |
//|                                       http://www.metaquotes.net/ |
//+------------------------------------------------------------------+
#property copyright "Copyright © 2004, MetaQuotes Software Corp."
#property link      "http://www.metaquotes.net/"

#property indicator_separate_window
#property indicator_buffers 2
#property indicator_color1 DarkBlue
#property indicator_color2 Red

#property indicator_minimum 0
#property indicator_maximum 100
#property indicator_level1 30
#property indicator_level2 70
#property indicator_level3 50

//---- input parameters
extern int MomPeriod=14;
//---- buffers
double MomBuffer1[],MomBuffer2[];
//+------------------------------------------------------------------+
//| Custom indicator initialization function                         |
//+------------------------------------------------------------------+
int init()
  {
   string short_name;
//---- indicator line
   SetIndexStyle(0,DRAW_LINE);
   SetIndexBuffer(0,MomBuffer1);

   SetIndexStyle(1,DRAW_LINE);
   SetIndexBuffer(1,MomBuffer2);

//---- name for DataWindow and indicator subwindow label
   short_name="Aroon("+MomPeriod+")";
   IndicatorShortName(short_name);
   SetIndexLabel(0,short_name);
//----
   SetIndexDrawBegin(0,MomPeriod);
//----
   return(0);
  }
//+------------------------------------------------------------------+
//| Momentum                                                         |
//+------------------------------------------------------------------+
int start()
  {
   int i,counted_bars=IndicatorCounted();
//----
   if(Bars<=MomPeriod) return(0);  //bar kurang dari 14 keluar..
//---- initial zero
   if(counted_bars<1)  //..jika bar yang sudah terhitung lebih kecil dari 1 maka nol kan semua
   //mulai dari no buffer yang paling besar ke yang paling kecil=0
      for(i=1;i<=MomPeriod;i++) {
         MomBuffer1[Bars-i]=0.0;
         MomBuffer2[Bars-i]=0.0;
      }
//----
   i=Bars-MomPeriod-1;
   if(counted_bars>=MomPeriod) i=Bars-counted_bars-1;//15-14-1=0
   int nHigh,nLow;
   while(i>=0)
     {
      double Max=-100000;
      double Min=100000;
      for(int k=i;k<i+MomPeriod;k++){
         double Num=Close[k];
         if(Num>Max){
            Max=Num;
            nHigh=k;
         }
         if(Num<Min){
            Min=Num;
            nLow=k;
         }
      }

      //Aroon Indicator math..
      MomBuffer1[i]=100.0*(MomPeriod-(nHigh-i))/MomPeriod;
      MomBuffer2[i]=100.0*(MomPeriod-(nLow-i))/MomPeriod;
      i--;
     }
   return(0);
  }
//+------------------------------------------------------------------+
Comments