at_Itp4
Download script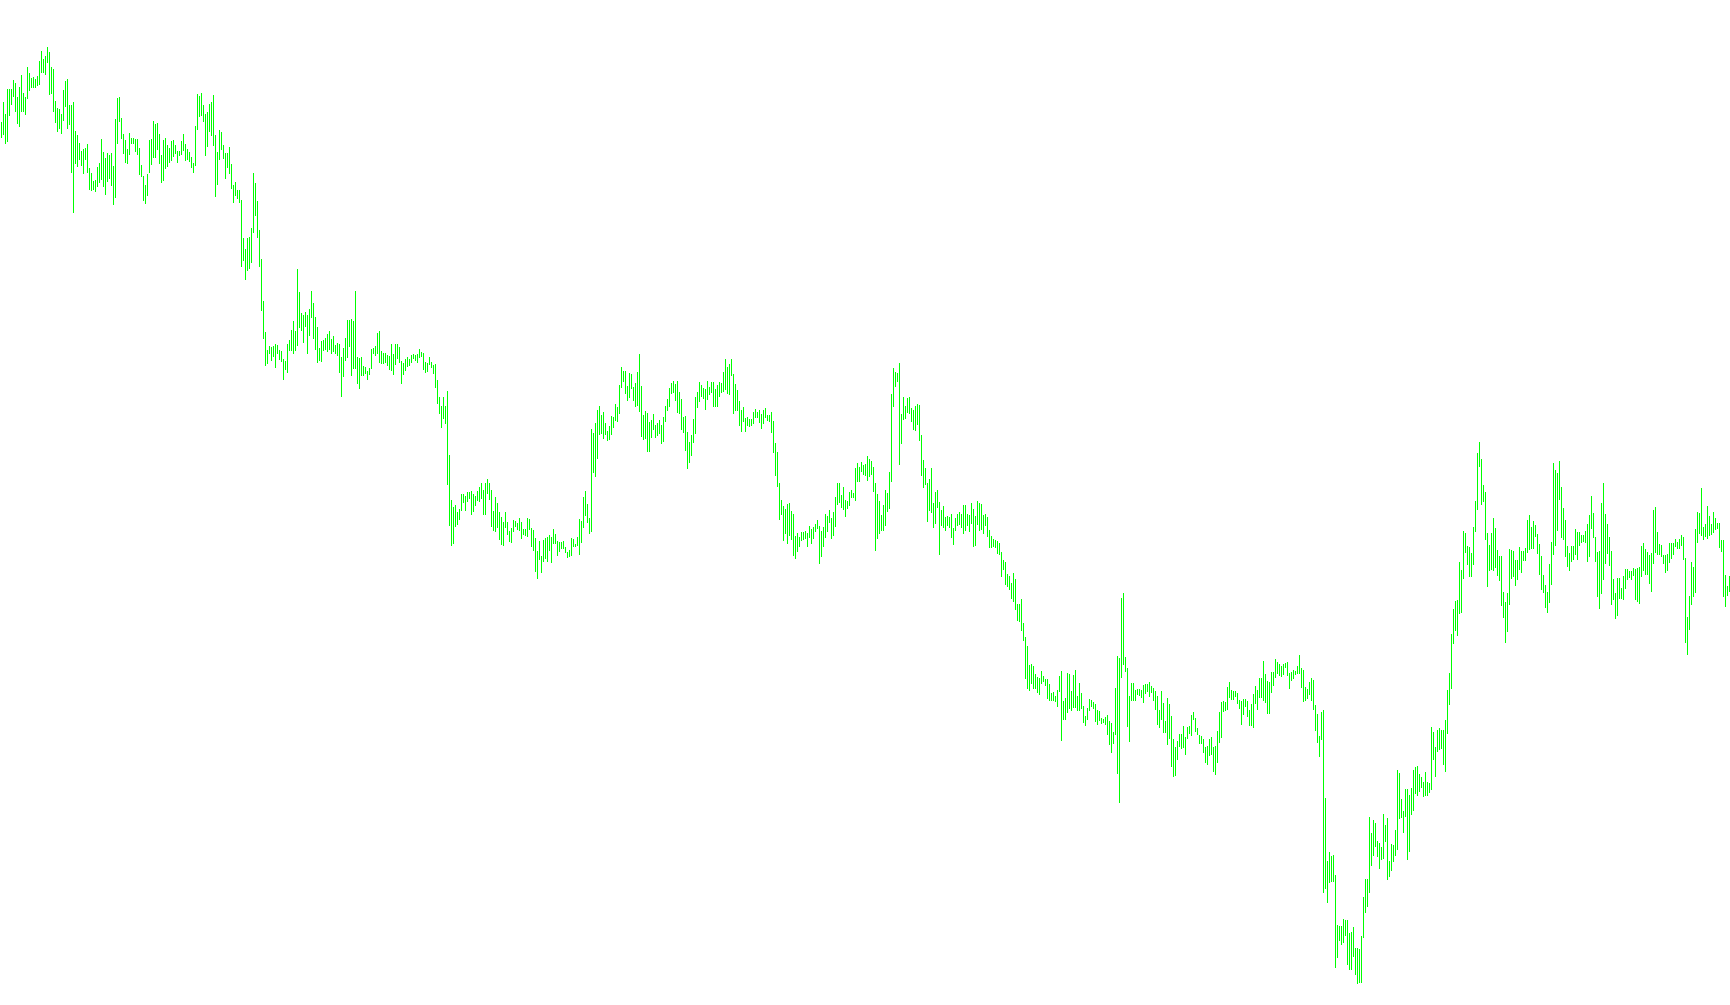
This script is designed as a visual financial indicator for the MetaTrader platform. Its primary purpose is to analyze historical price data and project it forward onto your trading chart to help visualize potential trends or movements.
How the Logic Works
The script operates by examining the relationship between current market prices and historical data points based on three main components:
1. Time-Based Scaling The logic begins by calculating a specific "window" of time based on the user's preferences (set in hours). It looks back at the market's history to identify recurring patterns, essentially deciding how far back it needs to look to make an informed calculation about the current price movement.
2. Data Interpolation and Smoothing The core of the script performs a mathematical "smoothing" process. Instead of looking at just one single price point, it looks at several points across a designated range. It takes the values from the start and the end of these ranges and calculates an average to find a middle ground. By repeating this calculation multiple times (iteratively), it creates a more fluid and less "noisy" representation of the market's path.
3. Polynomial Curve Fitting The final step of the logic is the most sophisticated. Once it has established the smoothed averages, the script applies a curve-fitting technique. It looks at three specific data points and uses them to draw a curved line through the space between them. This is intended to create a smooth, continuous arc rather than jagged, straight lines.
Summary of Visual Output
Instead of showing raw, erratic price jumps, this tool attempts to "connect the dots" by drawing a calculated curve. By using these mathematical averages and curve-fitting techniques, it provides a visual representation of the underlying trend, helping you see the "flow" of the market rather than just the immediate fluctuations.
//+------------------------------------------------------------------+
//|                                                    at_Itp(t).mq4 |
//|                      Copyright © 2005, MetaQuotes Software Corp. |
//|                                        http://www.metaquotes.net |
//+------------------------------------------------------------------+
#property copyright "Copyright © 2005, MetaQuotes Software Corp."
#property link      "http://www.metaquotes.net"

#property indicator_chart_window
#property indicator_buffers 1
#property indicator_color1 Red

extern int hours=4;
extern int s=10;
extern int cb=1000;

double ci[];
//================================================
int init()
  {
   SetIndexStyle(0,DRAW_LINE);
   SetIndexBuffer(0,ci);
   return(0);
  }
//================================================
int start()
  {
//   int    counted_bars=IndicatorCounted();
int i,x,m,pt,aa,bb,cc;
//----------------------------
pt=hours*60/Period();
//-----------------------
for (m=0; m<=s; m++)
{
i=0;
while (i<=cb)
{
if (m==0) { ci[cb+pt]=Close[cb+pt]; ci[i]=Close[i]; ci[cb+2*pt]=Close[cb+2*pt];}
if (m!=0 & m!=s) { ci[i+pt]=0.5*(ci[i]+ci[i+2*pt]); ci[0]=0.5*(ci[0]+ci[pt]);  ci[cb+2*pt]=0.5*(ci[cb+2*pt]+ci[cb+pt]); }
if (m==s) { aa=i; bb=i+pt; cc=i+2*pt;
for (x=i; x<=i+pt-1; x++)  {ci[x]=ci[aa]*((x-bb)*(x-cc))/((aa-bb)*(aa-cc))+ci[bb]*((x-aa)*(x-cc))/((bb-aa)*(bb-cc))+ci[cc]*((x-aa)*(x-bb))/((cc-aa)*(cc-bb));}
}

i=i+pt;
}
}
   return(0);
  }
//+------------------------------------------------------------------+
Comments