ATM_Pure_WPR_Alert_v2
Download script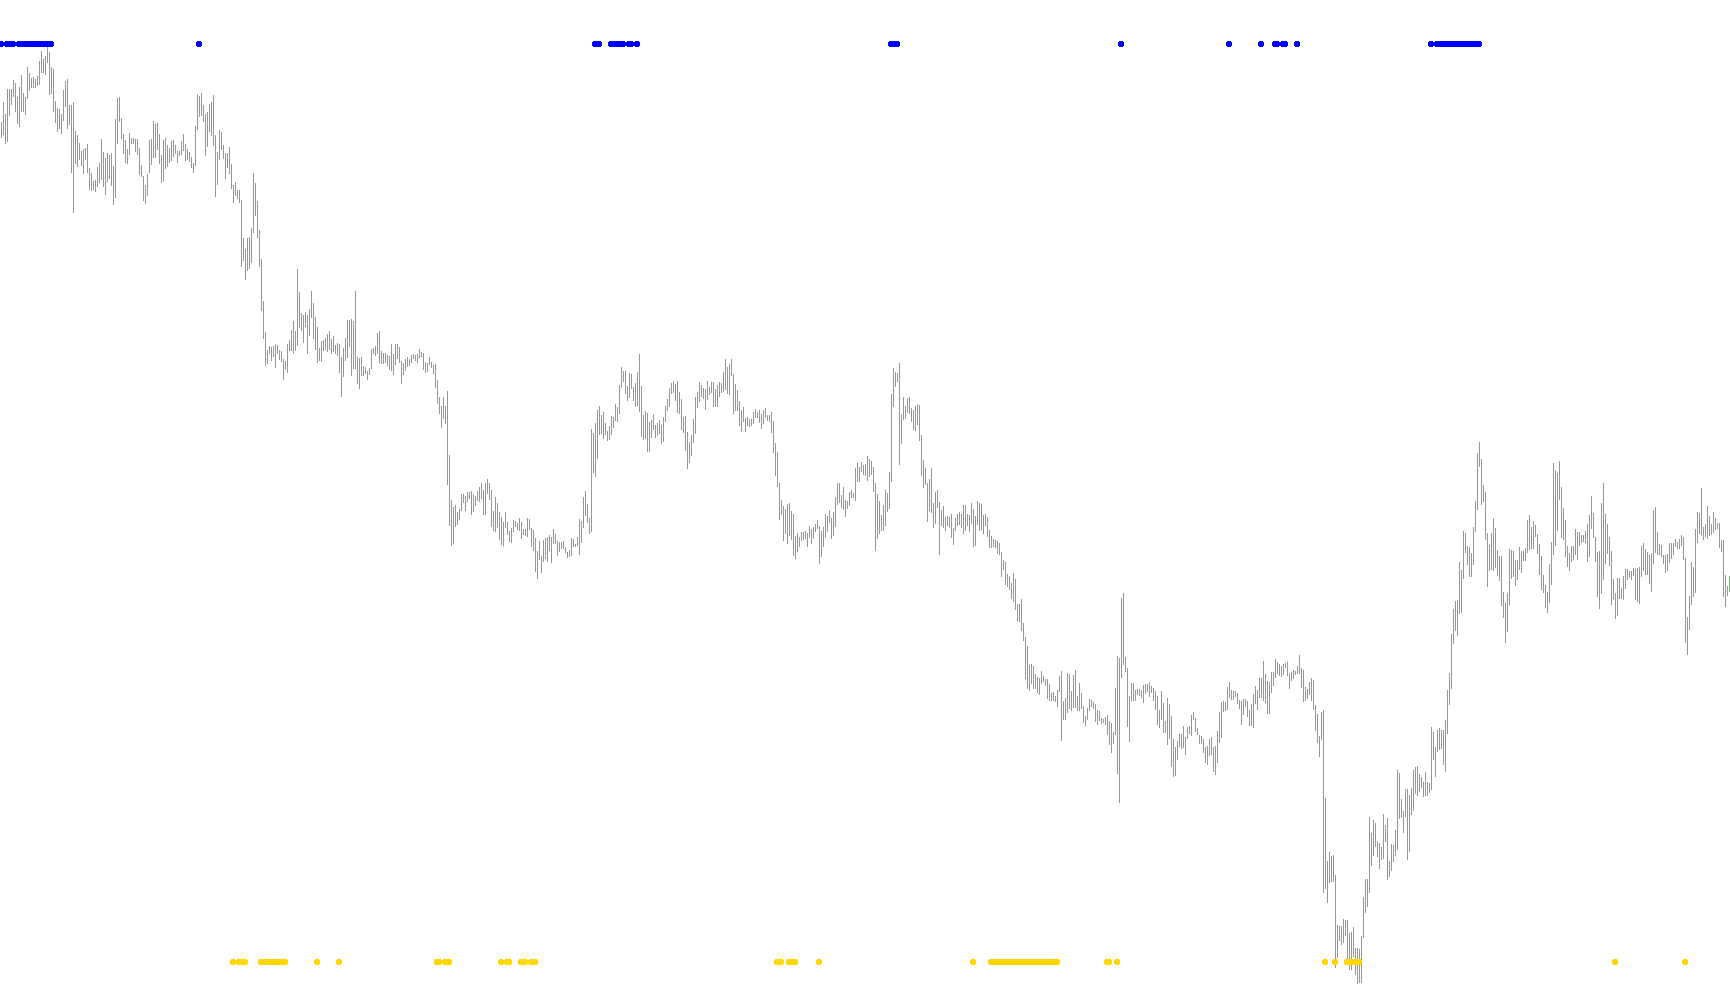
This tool is designed to help traders monitor market momentum by visualizing and alerting them to specific price extremes. It utilizes a technical analysis method known as the Williams Percent Range (WPR), which measures where the current market price sits relative to the high and low prices over a specific period of time.
Core Functionality
Momentum Tracking The script calculates a percentage value based on a user-defined timeframe (the default is set to 50 periods). This allows you to see how "stretched" the price is. Essentially, it determines if the price is currently trading near its recent highs or its recent lows.
Visual Signals The tool provides clear visual cues on your trading chart:
- Upper Dots: These appear when the market momentum reaches a specific high threshold (defined as the "Bear" level). This suggests that the price may be overextended to the upside.
- Lower Dots: These appear when the momentum drops below a specific low threshold (defined as the "Bull" level). This suggests that the price may be overextended to the downside.
Smart Alert System
One of the primary features of this script is its automated notification system. Instead of requiring you to watch the screen constantly, the tool can send real-time alerts based on two specific conditions:
- Lower Boundary Alerts: The system sends a notification when the price reaches an extreme low point, potentially signaling an opportunity where the market is "oversold."
- Upper Boundary Alerts: The system sends a notification when the price reaches an extreme high point, potentially signaling that the market is "overbought."
Key Technical Behaviors
- New Bar Detection: To prevent the alerts from triggering multiple times on a single candle, the script includes logic to detect "New Bars." It ensures that notifications are only processed once at the start of a new time period.
- Precision Handling: The script includes a specialized comparison function to ensure that mathematical calculations remain accurate and avoid minor rounding errors that can sometimes occur in trading software.
- Dynamic Timeframe Awareness: The tool is designed to recognize different chart types (such as 1-minute, 1-hour, or Daily charts) automatically, ensuring that the alerts are contextually relevant to whatever timeframe you are currently viewing.
//+------------------------------------------------------------------+
//| ATM_Pure_WPR_Alert v2.mq4 |
//| Copyright © 2005, MetaQuotes Software Corp. |
//| http://www.metaquotes.net/ |
//| DME July 20, 2009 Dropped line plot, added colored dots for
//| over sold / over bought conditions.
//+------------------------------------------------------------------+
#property copyright "Copyright © 2005, MetaQuotes Software Corp."
#property link "http://www.metaquotes.net/"
//----
#property indicator_separate_window
#property indicator_minimum -95
#property indicator_maximum -5
#property indicator_buffers 3
#property indicator_style1 DRAW_ARROW
#property indicator_style2 DRAW_ARROW
#property indicator_color1 Maroon
#property indicator_color2 MidnightBlue
#property indicator_color3 WhiteSmoke
#property indicator_width1 0
#property indicator_width2 0
//---- input parameters
extern int ExtWPRPeriod = 50;
extern string note = "turn on Alert = true; turn off = false";
extern bool AlertOn = true;
extern int BullLevel=-92;
extern int BearLevel=-8;
//---- buffers
double ExtWPRBuffer[];
double UpBuffer[];
double DnBuffer[];
// Show regular timeframe string (HCY)
string AlertPrefix;
string GetTimeFrameStr() {
switch(Period())
{
case 1 : string TimeFrameStr="M1"; break;
case 5 : TimeFrameStr="M5"; break;
case 15 : TimeFrameStr="M15"; break;
case 30 : TimeFrameStr="M30"; break;
case 60 : TimeFrameStr="H1"; break;
case 240 : TimeFrameStr="H4"; break;
case 1440 : TimeFrameStr="D1"; break;
case 10080 : TimeFrameStr="W1"; break;
case 43200 : TimeFrameStr="MN1"; break;
default : TimeFrameStr="CUR";
}
return (TimeFrameStr);
}
//+------------------------------------------------------------------+
//| Custom indicator initialization function |
//+------------------------------------------------------------------+
int init()
{
string sShortName;
//---- indicator buffer mapping
SetIndexStyle(0, DRAW_ARROW, STYLE_SOLID, 0);
SetIndexBuffer(0,UpBuffer);
SetIndexArrow(0,108); //234 241
SetIndexStyle(1, DRAW_ARROW, STYLE_SOLID, 0);
SetIndexBuffer(1,DnBuffer);
SetIndexArrow(1,108); //233 242
SetIndexBuffer(2, ExtWPRBuffer);
//---- indicator line
SetIndexStyle(3, DRAW_LINE);
//---- name for DataWindow and indicator subwindow label
sShortName="%R(" + ExtWPRPeriod + ")";
IndicatorShortName(sShortName);
SetIndexLabel(0, sShortName);
//---- first values aren't drawn
SetIndexDrawBegin(3, ExtWPRPeriod);
//----
AlertPrefix=Symbol()+" ("+GetTimeFrameStr()+"): ";
return(0);
}
//+------------------------------------------------------------------+
//| Williams Percent Range |
//+------------------------------------------------------------------+
int start()
{
int i, nLimit, nCountedBars;
double WPR;
//---- insufficient data
if(Bars <= ExtWPRPeriod)
return(0);
//---- bars count that does not changed after last indicator launch.
nCountedBars = IndicatorCounted();
//----Williams Percent Range calculation
i = Bars - ExtWPRPeriod - 1;
if(nCountedBars > ExtWPRPeriod)
i = Bars - nCountedBars - 1;
while(i >= 0)
{
double dMaxHigh = High[Highest(NULL, 0, MODE_HIGH, ExtWPRPeriod, i)];
double dMinLow = Low[Lowest(NULL, 0, MODE_LOW, ExtWPRPeriod, i)];
if(!CompareDouble((dMaxHigh - dMinLow), 0.0))
WPR = -100*(dMaxHigh - Close[i]) / (dMaxHigh - dMinLow);
// ExBuffer[i] = 1;
// UpBuffer[i+1]= EMPTY_VALUE; // UpDnZero;
// DnBuffer[i+1]= EMPTY_VALUE; // UpDnZero;
if(WPR >= BearLevel) { DnBuffer[i]= BearLevel; }
if(WPR <= BullLevel) { UpBuffer[i]= BullLevel; }
i--;
}
//----
// ======= Alert =========
if(AlertOn && NewBar()){
if((WPR <= BullLevel) && (WPR <=-indicator_minimum))
Alert(Symbol()+" M"+Period()+": ATM WPR Lower Dots");
else
if((WPR >= BearLevel) && (WPR <=indicator_maximum))
Alert(Symbol()+" M"+Period()+": ATM WPR Upper Dots");
}
// ======= Alert Ends =========
return(0);
}
//+------------------------------------------------------------------+
//| Ôóíêöèÿ ñðàíåíèÿ äâóõ âåùåñòâåííûõ ÷èñåë. |
//+------------------------------------------------------------------+
bool CompareDouble(double Number1, double Number2)
{
bool Compare = NormalizeDouble(Number1 - Number2, 8) == 0;
return(Compare);
}
//+------------------------------------------------------------------+
bool NewBar()
{
static datetime lastbar;
datetime curbar = Time[0];
//Print("NewBar(). lastbar="+TimeToStr(lastbar,TIME_DATE|TIME_MINUTES)+" curbar="+TimeToStr(curbar,TIME_DATE|TIME_MINUTES));
if(lastbar!=curbar)
{
lastbar=curbar;
return (true);
}
else
{
return(false);
}
}
Comments