ATR ratio
Download script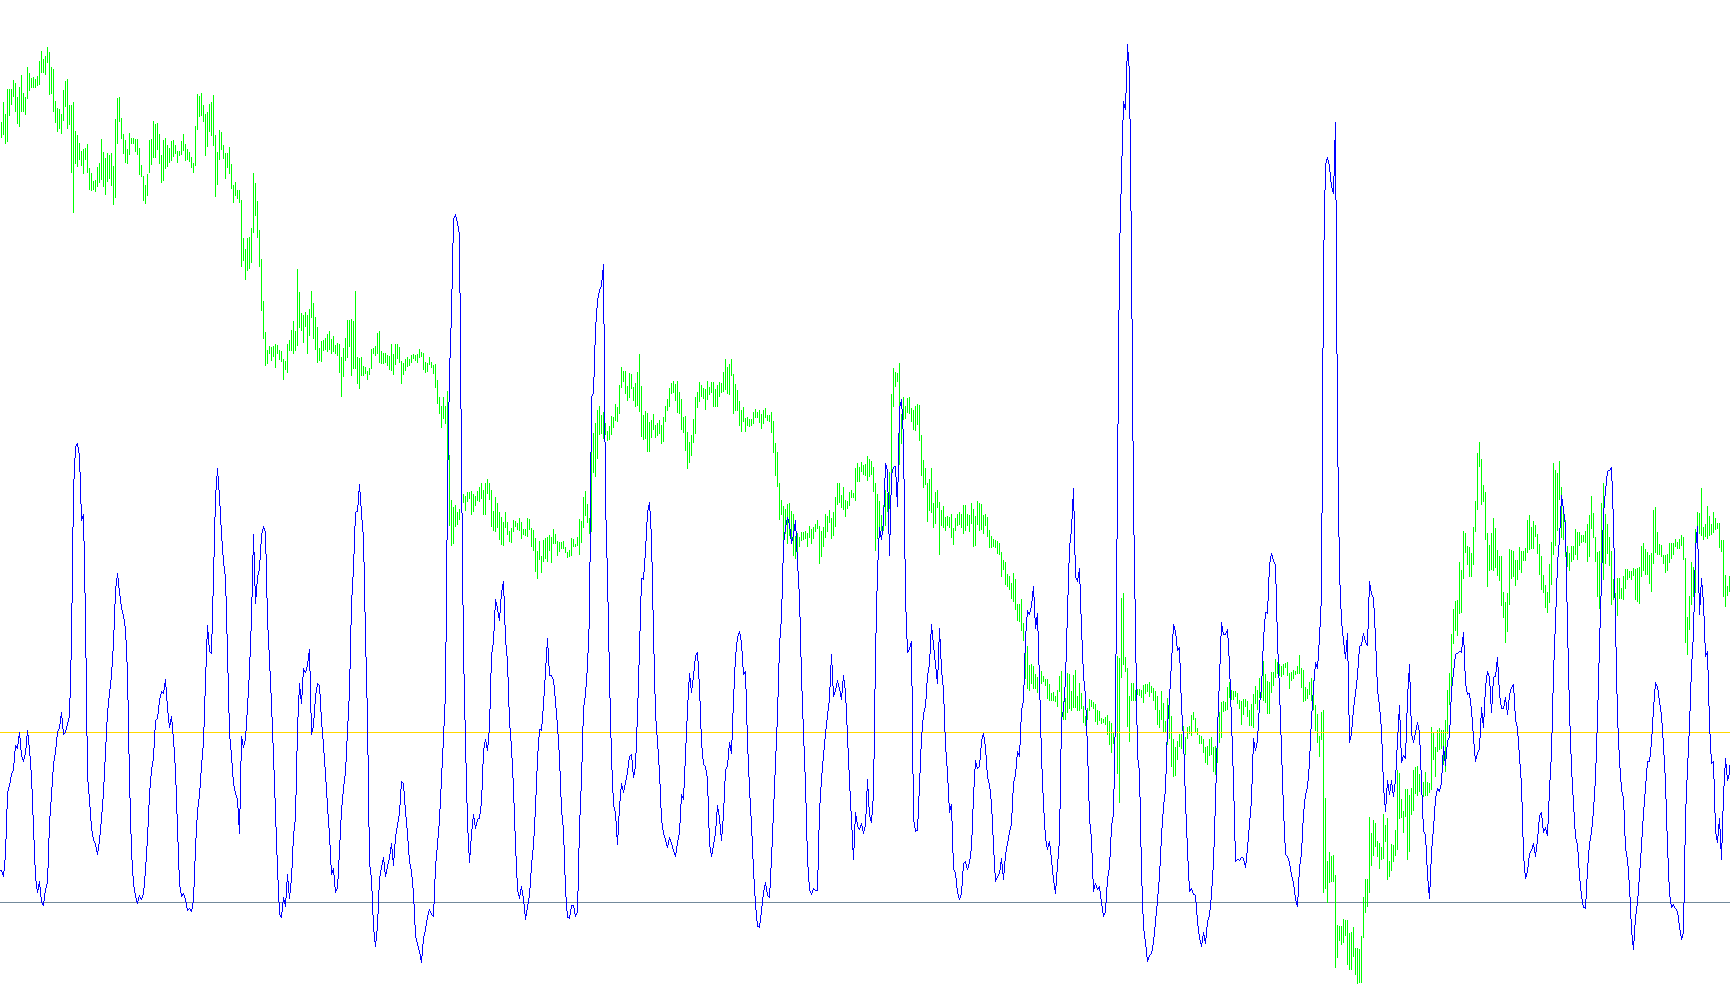
This indicator is designed to help traders visualize market volatility by comparing different time horizons on a single chart. Instead of looking at raw price movements, it focuses on the relative intensity of market fluctuations.
Core Logic Overview
The tool works by calculating the "Average True Range" (ATR)—a standard technical analysis metric that measures how much an asset typically moves during a specific period. The script performs a comparative analysis between two different speeds of this measurement:
- Short-Term Volatility: It tracks the immediate, rapid price movements over a small number of bars (the "short" period).
- Long-Term Volatility: It tracks the broader, more stable price trends over a much larger number of bars (the "long" period).
How the Calculation Works
The indicator creates a visual ratio by dividing the short-term volatility by the long-term volatility. By doing this, it strips away the absolute price values and focuses purely on the proportion of movement.
Essentially, it answers the question: "Is the market moving faster right now compared to its usual historical pace?"
Visual Representation
The script displays two distinct lines in a separate window below your main price chart:
- The Baseline: A steady horizontal line represents your chosen "Trigger Level." This serves as your benchmark for "normal" activity.
- The Ratio Line: A dynamic line that fluctuates based on the relationship between the short and long volatility periods.
How to Interpret the Results
- Above the Baseline: When the ratio line climbs above the trigger level, it indicates that current market volatility is high relative to the long-term average. This often suggests an expansion in price movement or a period of increased activity.
- Below the Baseline: When the ratio line stays below the trigger level, it suggests that the market is relatively quiet or consolidating compared to its historical norms.
By using this tool, traders can better identify shifts in market momentum, helping them distinguish between standard "noise" and significant changes in price behavior.
//+------------------------------------------------------------------+
//|                                                    ATR ratio.mq4 |
//|                         Copyright © 2005, Luis Guilherme Damiani |
//|                                      http://www.damianifx.com.br |
//+------------------------------------------------------------------+
#property copyright "Copyright © 2005, Luis Guilherme Damiani"
#property link      "http://www.damianifx.com.br"

#property indicator_separate_window
#property indicator_buffers 2
#property indicator_color1 Silver
#property indicator_color2 Violet
//---- input parameters
extern int       short_atr=7;
extern int       long_atr=49;
extern double    triglevel=1.00;
//---- buffers
double ExtMapBuffer1[];
double ExtMapBuffer2[];
//+------------------------------------------------------------------+
//| Custom indicator initialization function                         |
//+------------------------------------------------------------------+
int init()
  {
//---- indicators
   SetIndexStyle(0,DRAW_LINE);
   SetIndexBuffer(0,ExtMapBuffer1);
   SetIndexStyle(1,DRAW_LINE);
   SetIndexBuffer(1,ExtMapBuffer2);
//----
   return(0);
  }
//+------------------------------------------------------------------+
//| Custor indicator deinitialization function                       |
//+------------------------------------------------------------------+
int deinit()
  {
//----

//----
   return(0);
  }
//+------------------------------------------------------------------+
//| Custom indicator iteration function                              |
//+------------------------------------------------------------------+
int start()
  {
   int    counted_bars=IndicatorCounted();
   //Comment("ATR ratio= "+short_atr+" / "+long_atr);
   for(int i=0;i<Bars-counted_bars;i++)
   {
      ExtMapBuffer1[i]=triglevel;
      double sa=iATR(NULL,0,short_atr,i);
      ExtMapBuffer2[i]= sa/iATR(NULL,0,long_atr,i);
   }
//----

//----
   return(0);
  }
//+------------------------------------------------------------------+
Comments