Awesome User Variable
Download script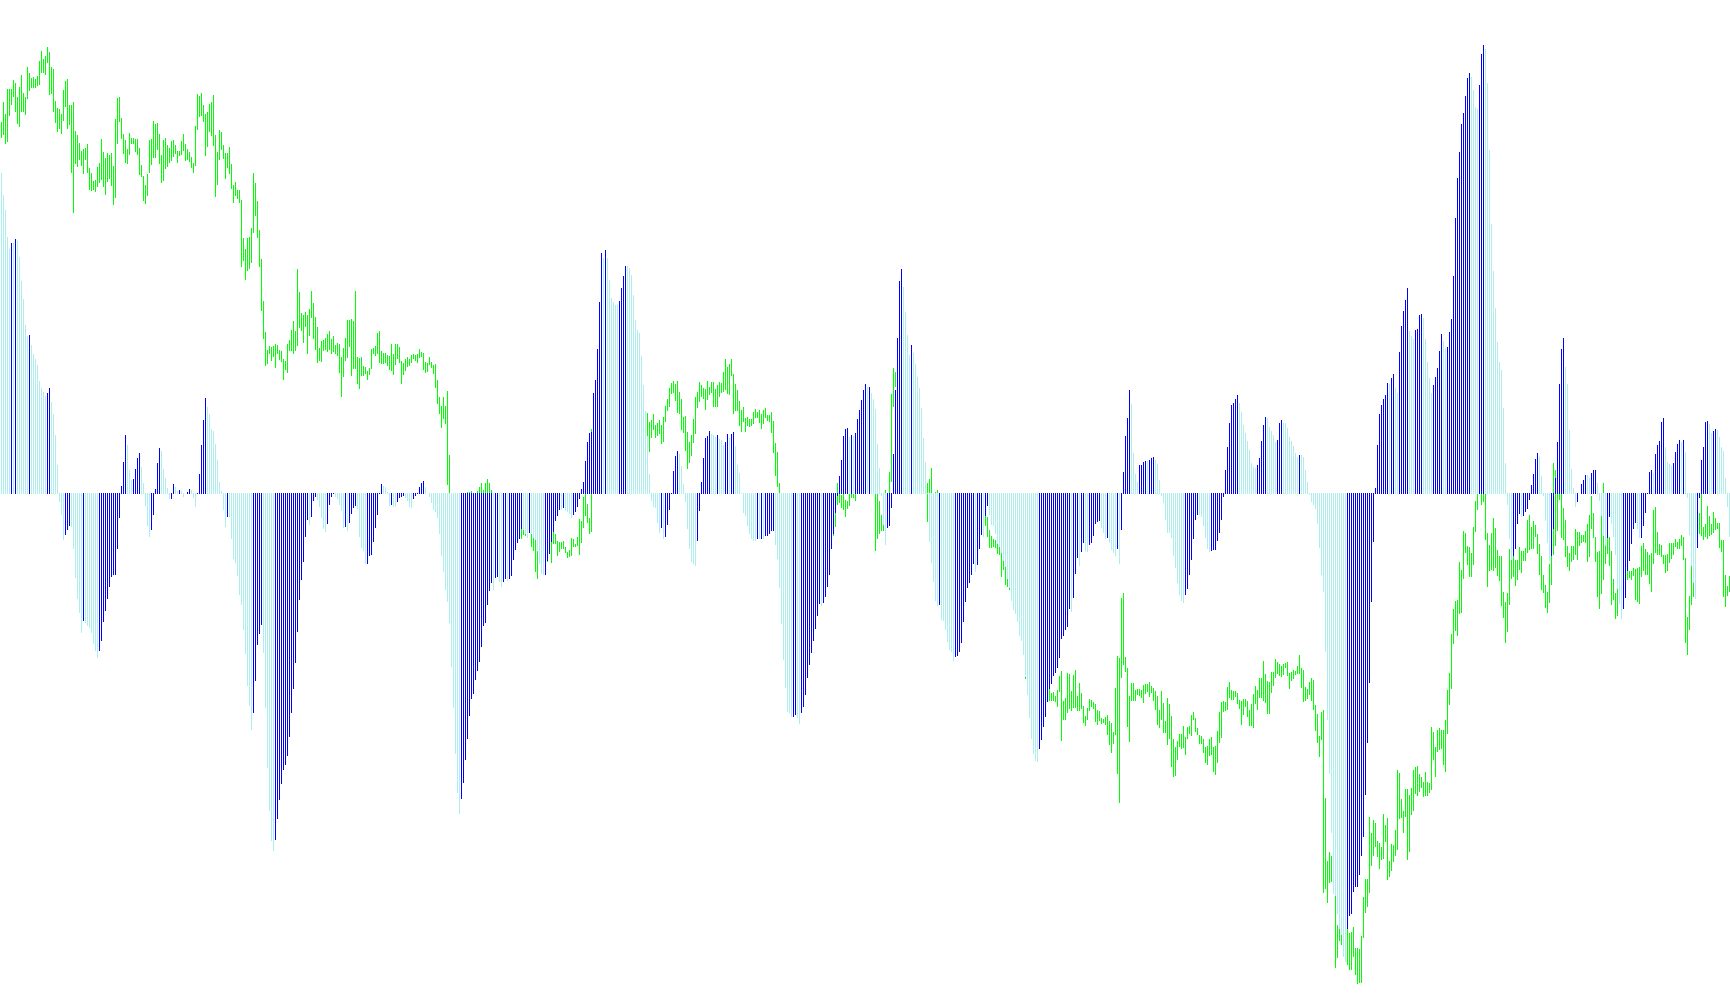
This tool is designed to provide a visual representation of market momentum by analyzing the relationship between two different moving averages. It functions as a specialized oscillator that helps traders identify the strength and direction of price trends.
Core Analytical Logic
The script operates by calculating the difference between two specific types of "Moving Averages"—mathematical tools that smooth out price fluctuations to show the underlying trend.
- Trend Comparison: The tool constantly compares a "fast" moving average (which reacts quickly to recent price changes) against a "slow" moving average (which reflects the longer-term trend).
- Momentum Calculation: By subtracting the slow value from the fast value, the script produces a specific momentum figure.
- When the fast average is significantly higher than the slow one, it indicates upward momentum.
- When the fast average falls below the slow one, it suggests downward momentum.
Visual Representation
Rather than just providing a single line, this tool uses a dynamic histogram approach to make trend shifts easier to spot at a glance:
- Directional Coloring: The tool identifies whether the current momentum is increasing or decreasing compared to the previous data point.
- Dynamic Histograms: Instead of simply showing all values in one block, it separates the results into two distinct visual components. It highlights the "active" momentum based on whether the trend is currently gaining strength or losing ground.
- Trend Switching: As soon as the momentum shifts from positive to negative (or vice versa), the tool switches its visual output. This allows traders to see exactly where a trend might be reaching its peak or bottom by watching the histogram's behavior change in real-time.
In summary, this script simplifies complex price data into a clear, color-coded visual of market energy, helping users distinguish between active trends and potential reversals.
Indicators Used
Miscellaneous
16
Views
0
Downloads
0
Favorites
Awesome User Variable
/*-----------------------------+
|			       |
| Shared by www.Aptrafx.com    |
|			       |
+------------------------------*/

//+------------------------------------------------------------------+
//|                                                      Awesome.mq4 |
//|                      Copyright © 2005, MetaQuotes Software Corp. |
//|                                       http://www.metaquotes.net/ |
//+------------------------------------------------------------------+
#property  copyright "Copyright © 2005, MetaQuotes Software Corp."
#property  link      "http://www.metaquotes.net/"
//---- indicator settings
#property  indicator_separate_window
#property  indicator_buffers 3
#property  indicator_color1  Black
#property  indicator_color2  Green
#property  indicator_color3  Red

//---- external variables
//iMA(Symbol(),mafasttimeframe,mafastperiod,mafastshift,mafastmode,mafastappliedprice,i)-
//iMA(Symbol(),maslowtimeframe,maslowperiod,maslowshift,maslowmode,maslowappliedprice,i)
double mafast,maslow;
extern int mafasttimeframe    =0;
extern int mafastperiod       =5;
extern int mafastshift        =0;
extern int mafastmode         =0;//0 sma 1 ema 2 smma 3 lwma
extern int mafastappliedprice =4;
/* PRICE_CLOSE    0 Close price.
   PRICE_OPEN     1 Open price.
   PRICE_HIGH     2 High price.
   PRICE_LOW      3 Low price.
   PRICE_MEDIAN   4 Median price, (high+low)/2.
   PRICE_TYPICAL  5 Typical price, (high+low+close)/3.
   PRICE_WEIGHTED 6 Weighted close price, (high+low+close+close)/4.*/
extern int maslowtimeframe    =0;
extern int maslowperiod       =34;
extern int maslowshift        =0;
extern int maslowmode         =0;// 0 sma 1 ema 2 smma 3 lwma
extern int maslowappliedprice =4;


//---- indicator buffers
double     ExtBuffer0[];
double     ExtBuffer1[];
double     ExtBuffer2[];

//+------------------------------------------------------------------+
//| Custom indicator initialization function                         |
//+------------------------------------------------------------------+
int init()
  {
   //---- drawing settings
   SetIndexStyle(0,DRAW_NONE);
   SetIndexStyle(1,DRAW_HISTOGRAM);
   SetIndexStyle(2,DRAW_HISTOGRAM);
   IndicatorDigits(Digits+1);
   SetIndexDrawBegin(0,34);
   SetIndexDrawBegin(1,34);
   SetIndexDrawBegin(2,34);
//---- 3 indicator buffers mapping
   SetIndexBuffer(0,ExtBuffer0);
   SetIndexBuffer(1,ExtBuffer1);
   SetIndexBuffer(2,ExtBuffer2);
//---- name for DataWindow and indicator subwindow label
   IndicatorShortName("AO UV");
   SetIndexLabel(1,NULL);
   SetIndexLabel(2,NULL);
//---- initialization done
   return(0);
  }
//+------------------------------------------------------------------+
//| Awesome Oscillator                                               |
//+------------------------------------------------------------------+
int start()
  {
   int    limit;
   int    counted_bars=IndicatorCounted();
   double prev,current;
//---- last counted bar will be recounted
   if(counted_bars>0) counted_bars--;
   limit=Bars-counted_bars;
//---- macd
   for(int i=0; i<limit; i++)
      ExtBuffer0[i]=iMA(NULL,0,5,0,MODE_SMA,PRICE_OPEN,i)-iMA(NULL,0,34,0,MODE_SMA,PRICE_OPEN,i);
//---- dispatch values between 2 buffers
   bool up=true;
   for(i=limit-1; i>=0; i--)
     {
      current=ExtBuffer0[i];
      prev=ExtBuffer0[i+1];
      if(current>prev) up=true;
      if(current<prev) up=false;
      if(!up)
        {
         ExtBuffer2[i]=current;
         ExtBuffer1[i]=0.0;
        }
      else
        {
         ExtBuffer1[i]=current;
         ExtBuffer2[i]=0.0;
        }
     }
//---- done
   return(0);
  }
Comments