BackToFuture-B
Download script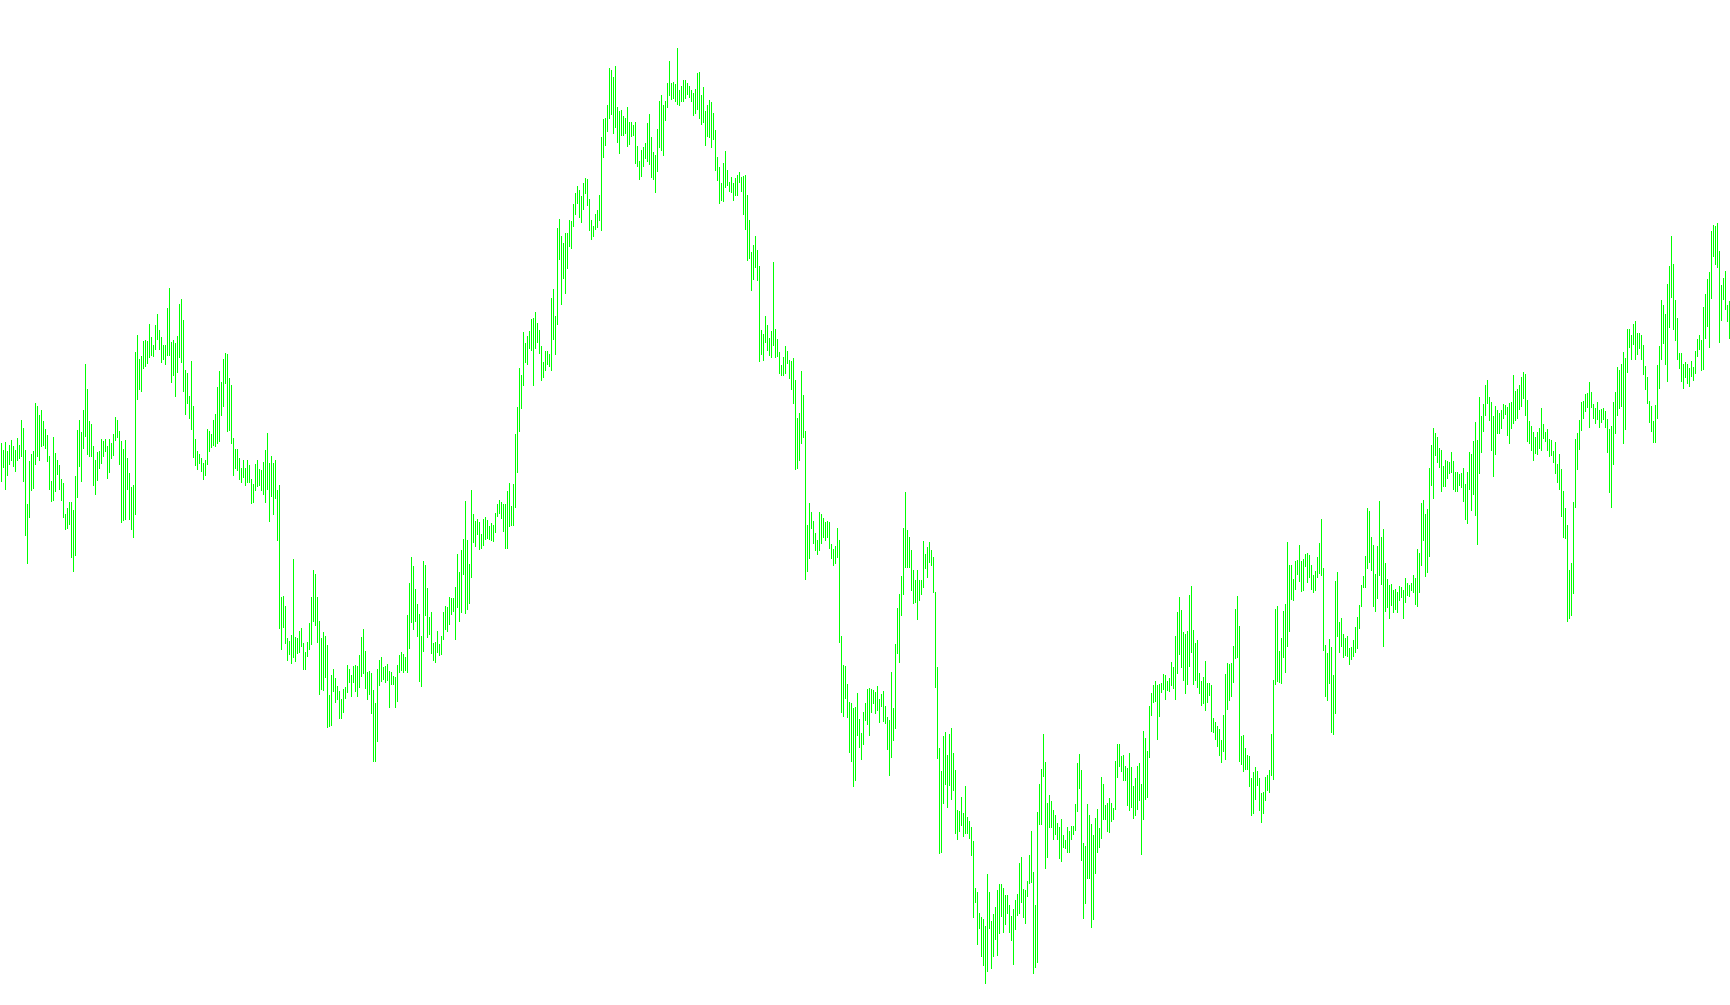
This indicator is designed to help traders visualize price momentum and identify specific "overbought" or "oversold" zones within a separate window on your trading chart. Instead of looking at the raw price action, it translates the movement of each candle into a percentage-based scale from 0 to 100.
How the Logic Works
1. Individual Candle Analysis The tool starts by examining every individual candle on your chart. It calculates where the closing price sits relative to the high and low prices of that specific period. By doing this, it determines how much "room" is left in the price movement for that bar. If a candle closes near its high, it receives a high score; if it closes near its low, it receives a low score.
2. Smoothing the Data
To prevent the indicator from being too jumpy or reactive to single erratic candles, the script uses a "smoothing" period (defined by the indPeriod setting). It takes the scores of several consecutive candles and calculates their average. This creates a fluid line that shows the general trend of price strength over a short window of time.
3. Identifying Key Zones The primary output is a main line that fluctuates between 0 and 100. The tool identifies three distinct behaviors based on where this line sits:
- The Upper Bound (Overbought): When the smoothed average reaches or exceeds the "Up Level" (set at 76.4), the indicator signals that price momentum is reaching a peak. This is highlighted by a specific color change to alert you that the market might be stretched.
- The Lower Bound (Oversold): When the smoothed average drops to or below the "Down Level" (set at 23.6), the indicator signals that price momentum is hitting a floor. This is highlighted with a different color to suggest the market may be reaching a bottom.
- The Neutral Zone: When the line stays between these two levels, it represents the standard flow of the market.
Summary for Traders
Think of this tool as a "momentum gauge." It filters out the noise of individual price ticks to show you where the "weight" of the price is moving. By watching the main line move toward the top or bottom boundaries, you can better identify potential reversal points or areas where the market has become overextended in one direction.
/*------------------------------------------------------------------+
 |                                               BackToFuture-B.mq4 |
 |                                                 Copyright © 2010 |
 |                                             basisforex@gmail.com |
 +------------------------------------------------------------------*/
#property copyright "Copyright © 2010, basisforex@gmail.com"
#property link      "basisforex@gmail.com"
//-----
#property indicator_separate_window
#property indicator_buffers 3
#property indicator_color1 Yellow
#property indicator_color2 Red
#property indicator_color3 Green
#property indicator_minimum 0
#property indicator_maximum 100
#property indicator_level1 76
#property indicator_level2 62
#property indicator_level3 50
#property indicator_level4 38
#property indicator_level5 24
//-----
extern int      indPeriod  = 4;
extern double   UpLevel    = 76.4;
extern double   DnLevel    = 23.6;
//-----
double MainBuffer[];
double bufRed[];
double bufGreen[];
double buf[];
double sumH[];
//+------------------------------------------------------------------+
int init()
 {
   IndicatorBuffers(5);

   string short_name;
   SetIndexStyle(0, DRAW_LINE, STYLE_SOLID, 1);
   SetIndexBuffer(0, MainBuffer);
   //------
   SetIndexStyle(1, DRAW_LINE, STYLE_SOLID, 2);
   SetIndexBuffer(1, bufRed);
   //------
   SetIndexStyle(2, DRAW_LINE, STYLE_SOLID, 2);
   SetIndexBuffer(2, bufGreen);
   //------
   SetIndexBuffer(3, buf);
   SetIndexBuffer(4, sumH);
   //-----
   short_name="BackToFuture("+indPeriod+")";
   IndicatorShortName(short_name);
   return(0);
 }
//+------------------------------------------------------------------+
int start()
 {
   double sumC = 0;
   int counted_bars = IndicatorCounted();
   int i, j, k;
   j = Bars - indPeriod;
   if(counted_bars >= indPeriod) j = Bars - counted_bars - 1;
   //-----
   for(i = j; i >= 0; i--)
    {
      buf[i] = 100 * ((Close[i] - Low[i]) / ((High[i] - Low[i]) + Point));
      for(k = i; k < i + indPeriod; k++)
       {
         sumC += buf[k];
       }
      sumH[i] = sumC / indPeriod;
      //---------------------
      MainBuffer[i] = sumH[i];
      if(sumH[i] >= UpLevel)
       {
         bufRed[i] = sumH[i];
       }
      if(sumH[i] <= DnLevel)
       {
         bufGreen[i] = sumH[i];
       }
      //-----
      sumC = 0;
    }
   //-----
   return(0);
 }
Comments