BB_MACD_v1
Download script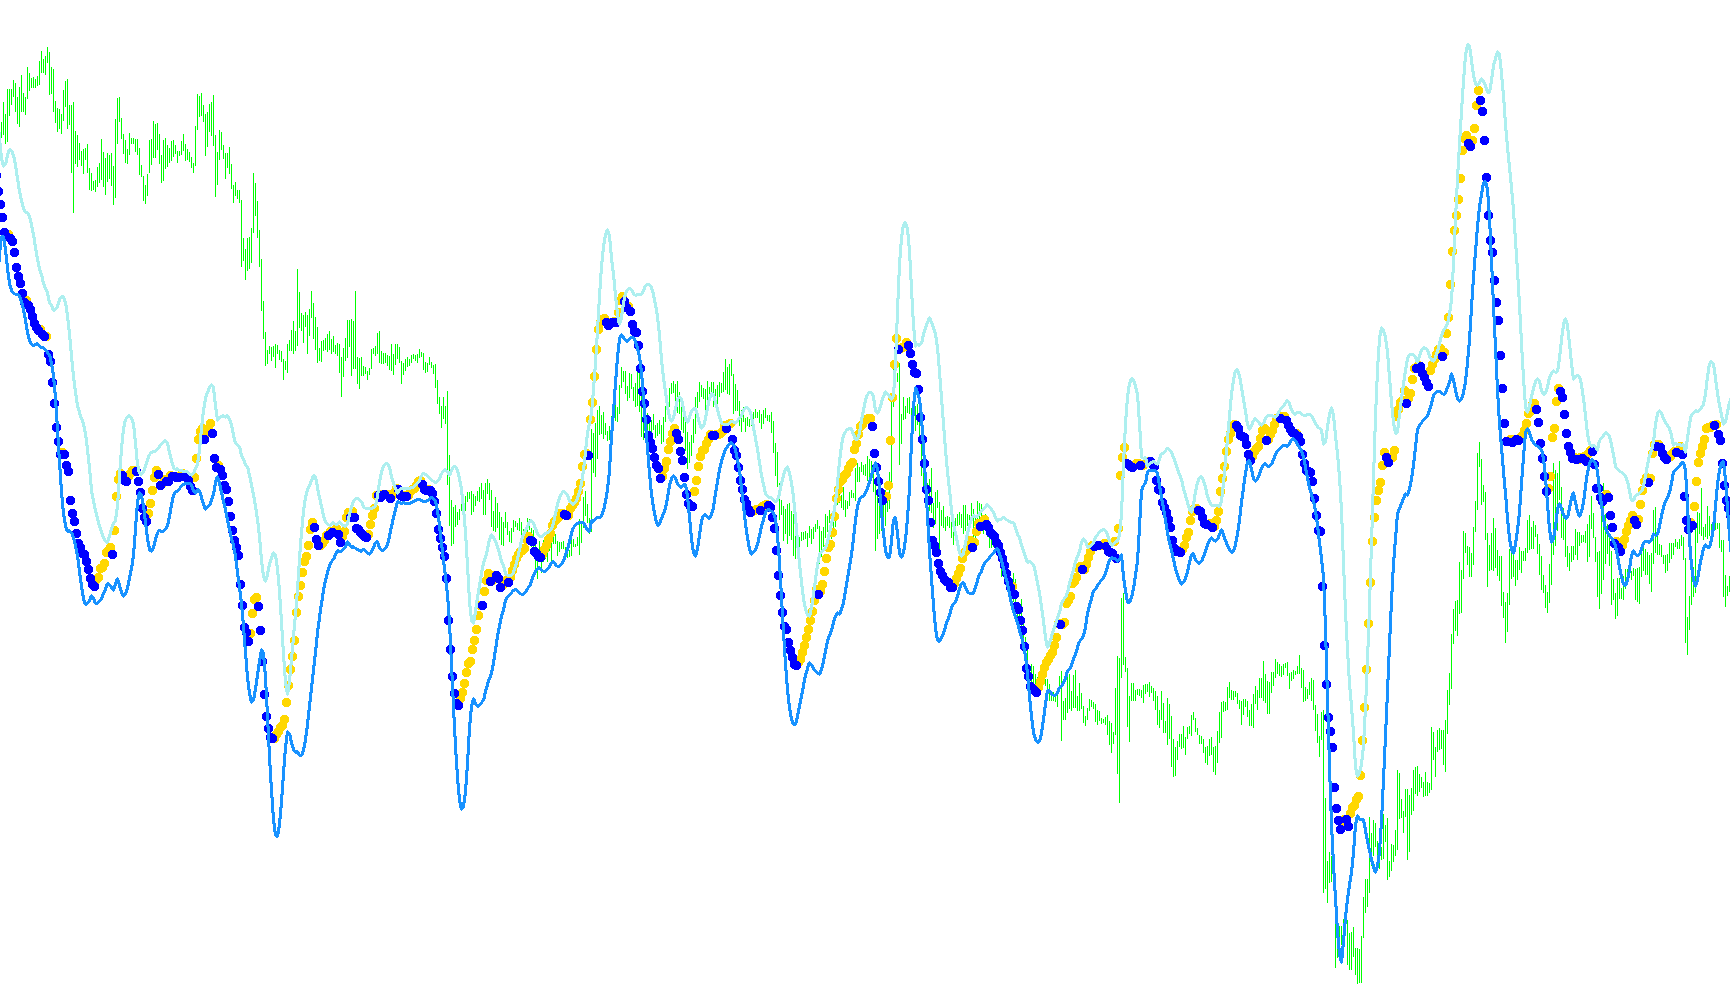
This custom indicator combines two well-known technical analysis tools—the Moving Average Convergence Divergence (MACD) and Bollinger Bands—into a single visual dashboard. Its primary purpose is to help traders identify momentum trends and potential price exhaustion points by analyzing the volatility of the MACD itself.
Core Logic Overview
The script operates through three distinct layers of data processing:
1. The Foundation: MACD Calculation First, the indicator calculates a standard MACD value. It does this by measuring the difference between two different types of moving averages (Fast and Slow). This represents the underlying momentum of the market price.
2. The Modification: Bollinger Bands on MACD Instead of applying Bollinger Bands directly to the price chart, this script applies them to the MACD values.
- It calculates a "moving average" of the MACD trend.
- It then calculates the standard deviation (volatility) of that trend.
- Finally, it creates an Upper and Lower Band based on those calculations. This effectively creates a "channel" around the momentum line, showing whether the current momentum is behaving normally or if it is reaching extreme levels.
3. Visual Signaling and Trend Detection The script provides specific visual cues to help differentiate between upward and downward movements:
- Trend Direction: The indicator tracks whether the MACD value is rising or falling compared to the previous data point.
- Dynamic Arrows: It uses a logic gate to show specific markers (arrows). If the momentum is increasing, it hides one set of markers; if the momentum is decreasing, it hides the other. This helps the user quickly identify the direction of the "pulse" in the market.
- Boundary Visualization: The Upper and Lower bands are drawn as solid lines, providing a visual boundary for the momentum. When the MACD values push toward or outside these bands, it often signifies that the current trend is becoming overextended.
Summary for the User
Think of this tool as a "volatility gauge for momentum." While a standard MACD tells you if the price is moving up or down, this script tells you how strongly and how erratically that movement is happening. By watching where the MACD line sits relative to its own Bollinger Bands, you can better visualize whether a trend is gaining strength, losing steam, or becoming overstretched.
//+------------------------------------------------------------------+
//|                                               Custom BB_MACD.mq4 |
//|                                     Copyright © 2005, adoleh2000 |
//|                                       http://www.metaquotes.net/ |
//+------------------------------------------------------------------+
#property  copyright "Copyright © 2005, adoleh2000"
#property  link      "http://www.metaquotes.net/"
//---- indicator settings
#property  indicator_separate_window
#property  indicator_buffers 4
#property  indicator_color1  Lime  //bbMacd up
#property  indicator_color2  Red  //bbMacd up
#property  indicator_color3  Blue  //Upperband
#property  indicator_color4  Red //Lowerband


//---- indicator parameters

extern int FastLen=12;
extern int SlowLen=26;
extern int Length=10;
extern double StDv=2.5;

int loopbegin;
int shift;

double zeroline;

//---- indicator buffers
//---- buffers
double ExtMapBuffer1[]; // bbMacd
double ExtMapBuffer2[]; // bbMacd
double ExtMapBuffer3[]; // Upperband Line
double ExtMapBuffer4[]; // Lowerband Line

double     bbMacd[];
double     bbMacdline;
double     Upperband[];
double     Lowerband[];
double     avg[];
double     sDev;
double     mean;
double     sumSqr;

//+------------------------------------------------------------------+
//| Custom indicator initialization function                         |
//+------------------------------------------------------------------+
int init()
  {
  //---- 6 additional buffers are used for counting.
   IndicatorBuffers(8);
//---- drawing settings

   SetIndexBuffer(0,ExtMapBuffer1);//bbMacd line
   SetIndexStyle(0,DRAW_ARROW,STYLE_SOLID,1);
   SetIndexArrow(0,108);
   IndicatorDigits(MarketInfo(Symbol(),MODE_DIGITS)+1);


   SetIndexBuffer(1,ExtMapBuffer2);//bbMacd line
   SetIndexStyle(1,DRAW_ARROW,STYLE_SOLID,1);
   SetIndexArrow(1,108);
   IndicatorDigits(MarketInfo(Symbol(),MODE_DIGITS)+1);

   SetIndexBuffer(2,ExtMapBuffer3); //Upperband line
   SetIndexStyle(2,DRAW_LINE,STYLE_SOLID,3);
   IndicatorDigits(MarketInfo(Symbol(),MODE_DIGITS)+1);

   SetIndexBuffer(3,ExtMapBuffer4); //Lowerband line
   SetIndexStyle(3,DRAW_LINE,STYLE_SOLID,3);
   IndicatorDigits(MarketInfo(Symbol(),MODE_DIGITS)+1);


  SetIndexBuffer(4,bbMacd);
  SetIndexBuffer(5,Upperband);
  SetIndexBuffer(6,Lowerband);
  SetIndexBuffer(7,avg);


//---- name for DataWindow and indicator subwindow label
   IndicatorShortName("BB MACD ("+FastLen+","+SlowLen+","+Length+")");
   SetIndexLabel(0,"bbMacd");
   SetIndexLabel(1,"Upperband");
   SetIndexLabel(2,"Lowerband");

//---- initialization done
   return(0);
  }
//+------------------------------------------------------------------+
//| Custor indicator deinitialization function |
//+------------------------------------------------------------------+

  int deinit()
{
//---- TODO: add your code here
// --------------------------
//----
return(0);
}

//+------------------------------------------------------------------+
//| Moving Averages Convergence/Divergence                           |
//+------------------------------------------------------------------+
int start()
  {

   int limit;
   int counted_bars=IndicatorCounted();
//---- check for possible errors
   if(counted_bars<0) return(-1);
//---- last counted bar will be recounted
   if(counted_bars>0) counted_bars--;
   limit=Bars-counted_bars;
      //loopbegin = Bars-1;
      //for(int i = loopbegin; i >= 0; i--)
      for(int i=0; i<limit; i++)
        bbMacd[i]=iMA(NULL,0,FastLen,0,MODE_EMA,PRICE_CLOSE,i) - iMA(NULL,0,SlowLen,0,MODE_EMA,PRICE_CLOSE,i);
      for(i=0; i<limit; i++)
      {
        avg[i]=iMAOnArray(bbMacd,0,Length,0,MODE_EMA,i);

       //Comment("avg[i]=",avg[i],"  bbMacd[i+1]=",bbMacd[i+1],"   bbMacd[i]=",bbMacd[i],"   Length=",Length,"  sDev=",sDev,"  Upperband=",Upperband[i],"  Lowerband=",Lowerband[i]);


        sDev = iStdDevOnArray(bbMacd,0,Length,MODE_EMA,0,i);


        Upperband[i] = avg[i] + (StDv * sDev);
        Lowerband[i] = avg[i] - (StDv * sDev);


      ExtMapBuffer1[i]=bbMacd[i];   //Uptrend bbMacd
      ExtMapBuffer2[i]=bbMacd[i];   // downtrend bbMacd
      ExtMapBuffer3[i]=Upperband[i];// Upperband
      ExtMapBuffer4[i]=Lowerband[i];//Lowerband


      if (bbMacd[i]>bbMacd[i+1])
      {
      ExtMapBuffer2[i]=EMPTY_VALUE;
      }

      if (bbMacd[i]<bbMacd[i+1])
      {
      ExtMapBuffer1[i]=EMPTY_VALUE;
      }


    }


//---- done
   return(0);

  }
//+------------------------------------------------------------------+
Comments