BB_PRC-1
Download script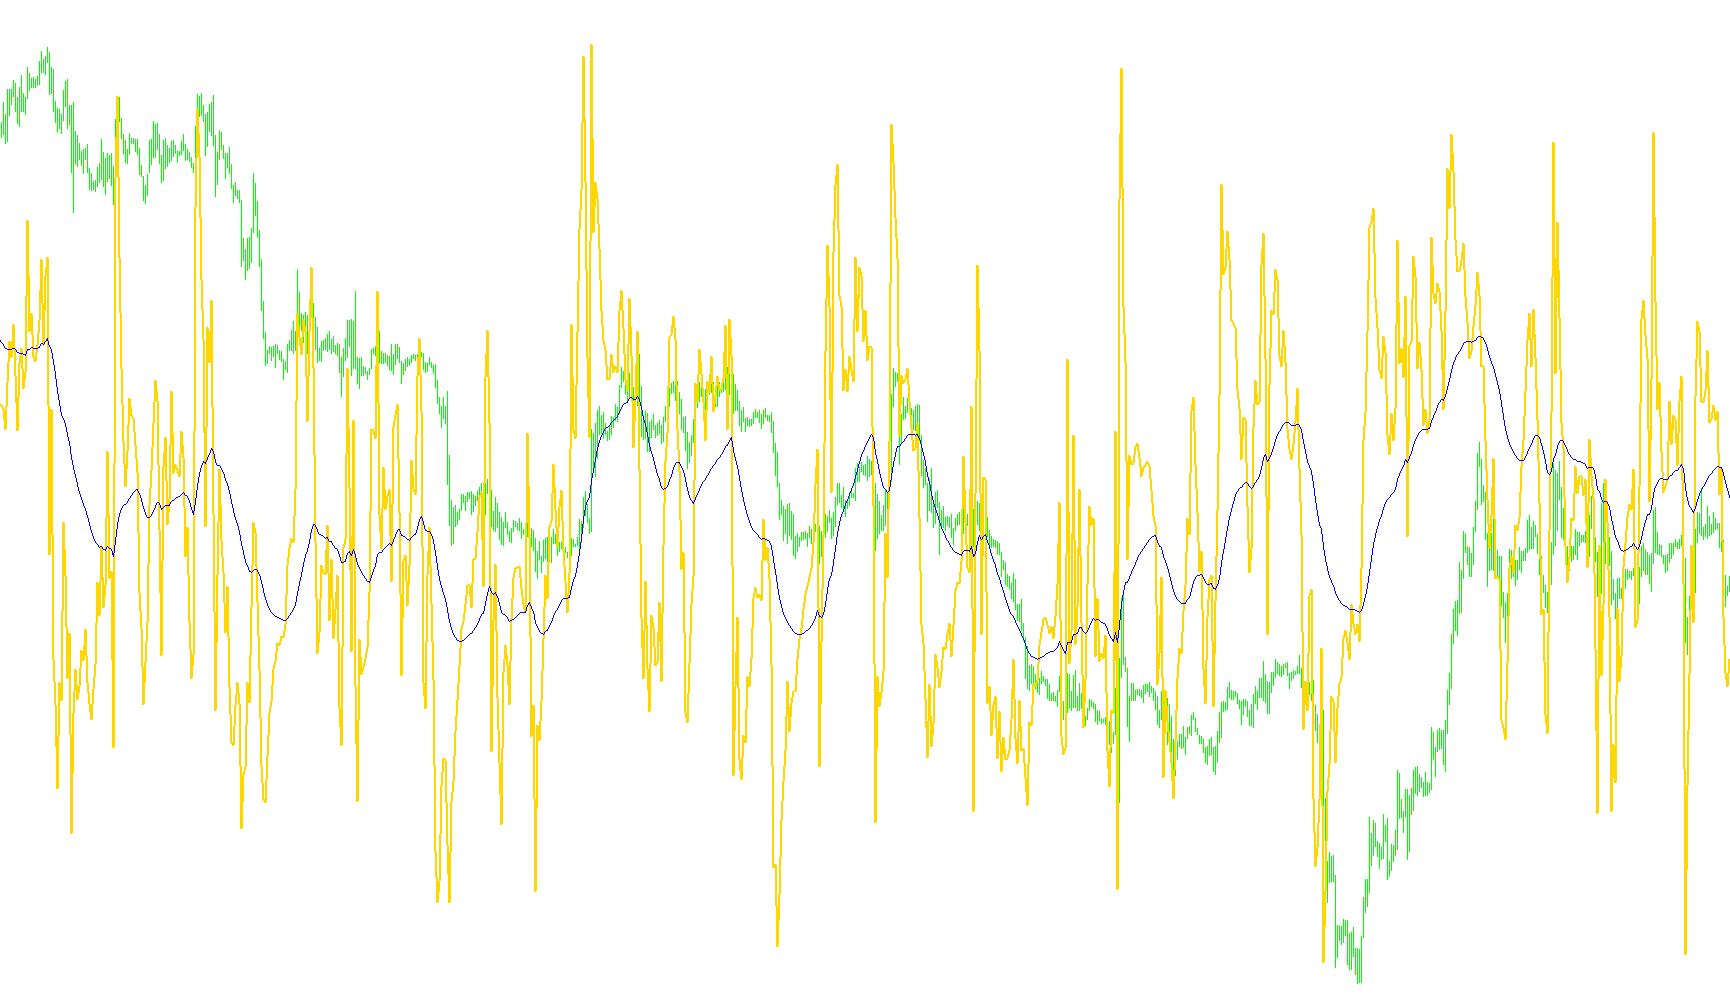
This technical indicator is designed to provide traders with a clearer picture of where the current market price sits in relation to its recent volatility. Instead of simply looking at raw price numbers, it translates market movement into a normalized range, making it easier to identify specific trend reversals and momentum shifts.
Core Logic and Data Processing
The tool operates by combining two primary layers of analysis:
1. Relative Position Mapping The indicator first calculates a "Bollinger Band" range. It then determines exactly where the current closing price sits within that range. By dividing the distance between the price and the lower boundary by the total width of the band, the tool generates a specific value (the bol line).
- Essentially, this tells you how "deep" into the high or low territory the price is reaching at any given moment, effectively smoothing out the noise of raw price fluctuations.
2. Trend Smoothing Once that relative position is established, the tool applies a Moving Average to this new value (the ma line). This creates a secondary layer of data that represents the "average" trend of the price's relative position. By using an Exponential Moving Average, the indicator reacts quickly to recent changes while filtering out minor market jitters.
Visual and Alert Signals
The tool provides visual cues on your chart and can be configured to send real-time notifications based on specific interactions between these two lines:
- Extreme Lows/Highs: The system monitors when the relative price position reaches a significant low or high point relative to its recent history. If the price "bottoms out" or "peaks out" in a specific way, an alert can trigger to notify you of this exhaustion.
- Momentum Crosses: The indicator watches for "crossovers." When the relative price line crosses above or below its moving average, it signals a shift in momentum.
- A crossover from above to below may suggest a transition toward a Sell sentiment.
- A crossover from below to above may suggest a transition toward a Buy sentiment.
Key Features for the Trader
- Customizable Sensitivity: You can adjust the periods and deviations to make the indicator more reactive or more stable depending on your trading style (e.g., scalping vs. swing trading).
- Smart Alerting: To prevent "alert fatigue," the script includes a sleep timer. Once an alert is triggered, it will pause further notifications for a set period, ensuring you are only notified of significant movements.
- Automated Monitoring: Rather than watching the screen constantly, the tool handles the heavy lifting of calculating these relative positions and cross-overs in real-time, notifying you immediately when conditions are met on your chosen timeframe.
//+------------------------------------------------------------------+
//|                                                       BB_PRC.mq4 |
//|                                                          Kalenzo |
//|                                      bartlomiej.gorski@gmail.com |
//+------------------------------------------------------------------+
#property copyright "Kalenzo"
#property link      "bartlomiej.gorski@gmail.com"
#property indicator_color1 Red
#property indicator_color2 Gold
#property indicator_buffers 2

double bol[];
double ma[];
extern int bPer=20,bDev=2,maPer=50,maMeth=MODE_EMA;
extern bool useAlerts = true;
extern int alertBar = 1;
extern int alertSleep = 1800;//in seconds
int lastAlert;
#property indicator_separate_window

//+------------------------------------------------------------------+
//| Custom indicator initialization function                         |
//+------------------------------------------------------------------+
int init()
  {
//---- indicators
   SetIndexBuffer(0,bol);
   SetIndexStyle(0,DRAW_LINE,EMPTY,2);

   SetIndexBuffer(1,ma);
   SetIndexStyle(1,DRAW_LINE,EMPTY,1);

   IndicatorShortName("BB PRC RANGE v1");
//----
   return(0);
  }
//+------------------------------------------------------------------+
//| Custor indicator deinitialization function                       |
//+------------------------------------------------------------------+
int deinit()
  {
//----

//----
   return(0);
  }
//+------------------------------------------------------------------+
//| Custom indicator iteration function                              |
//+------------------------------------------------------------------+
int start()
  {
   int limit;
   int counted_bars=IndicatorCounted();
   if(counted_bars<0) counted_bars=0;
   if(counted_bars>0) counted_bars--;
   limit=Bars-counted_bars-bPer;

   for(int i=0; i<=limit;i++)
   {
      double bandL = iBands(Symbol(),0,bPer,bDev,0,PRICE_CLOSE,MODE_MINUSDI,i);
      double bandH = iBands(Symbol(),0,bPer,bDev,0,PRICE_CLOSE,MODE_PLUSDI,i);
      bol[i] = ((Close[i]-bandL)/(bandH-bandL));

      if((Close[i]-bandL)==0 || (bandH-bandL)==0)
      Print(i," ",(Close[i]-bandL)," ",(bandH-bandL));
   }

   for(int j=0; j<=limit;j++)
   {
      ma[j] = iMAOnArray(bol,0,maPer,0,maMeth,j);
   }

   if(useAlerts)
   {
      if( ma[alertBar] >= bol[alertBar] && CurTime()>lastAlert && (bol[2+alertBar] >= bol[1+alertBar]) && (bol[1+alertBar] < bol[alertBar]))
      {
         Alert("BB PRC MADE LOW "+ Symbol() + " on the " +  Period() + " minute chart.");
         lastAlert = CurTime()+alertSleep;
      }

      if( ma[alertBar] <= bol[alertBar] && CurTime()>lastAlert && (bol[2+alertBar] <= bol[1+alertBar]) && (bol[1+alertBar] > bol[alertBar]))
      {
         Alert("BB PRC MADE HIGH "+ Symbol() + " on the " +  Period() + " minute chart.");
         lastAlert = CurTime()+alertSleep;
      }

      if( CurTime()>lastAlert && bol[alertBar+1] >= ma[alertBar+1] && bol[alertBar] < ma[alertBar])
      {
         Alert("BB PRC CROSSED MA FOR SELL "+ Symbol() + " on the " +  Period() + " minute chart.");
         lastAlert = CurTime()+alertSleep;
      }

      if( CurTime()>lastAlert && bol[alertBar+1] <= ma[alertBar+1] && bol[alertBar] > ma[alertBar])
      {
         Alert("BB PRC CROSSED MA FOR BUY "+ Symbol() + " on the " +  Period() + " minute chart.");
         lastAlert = CurTime()+alertSleep;
      }
   }

   return(0);
  }
//+------------------------------------------------------------------+
Comments