bbhisto_v1
Download script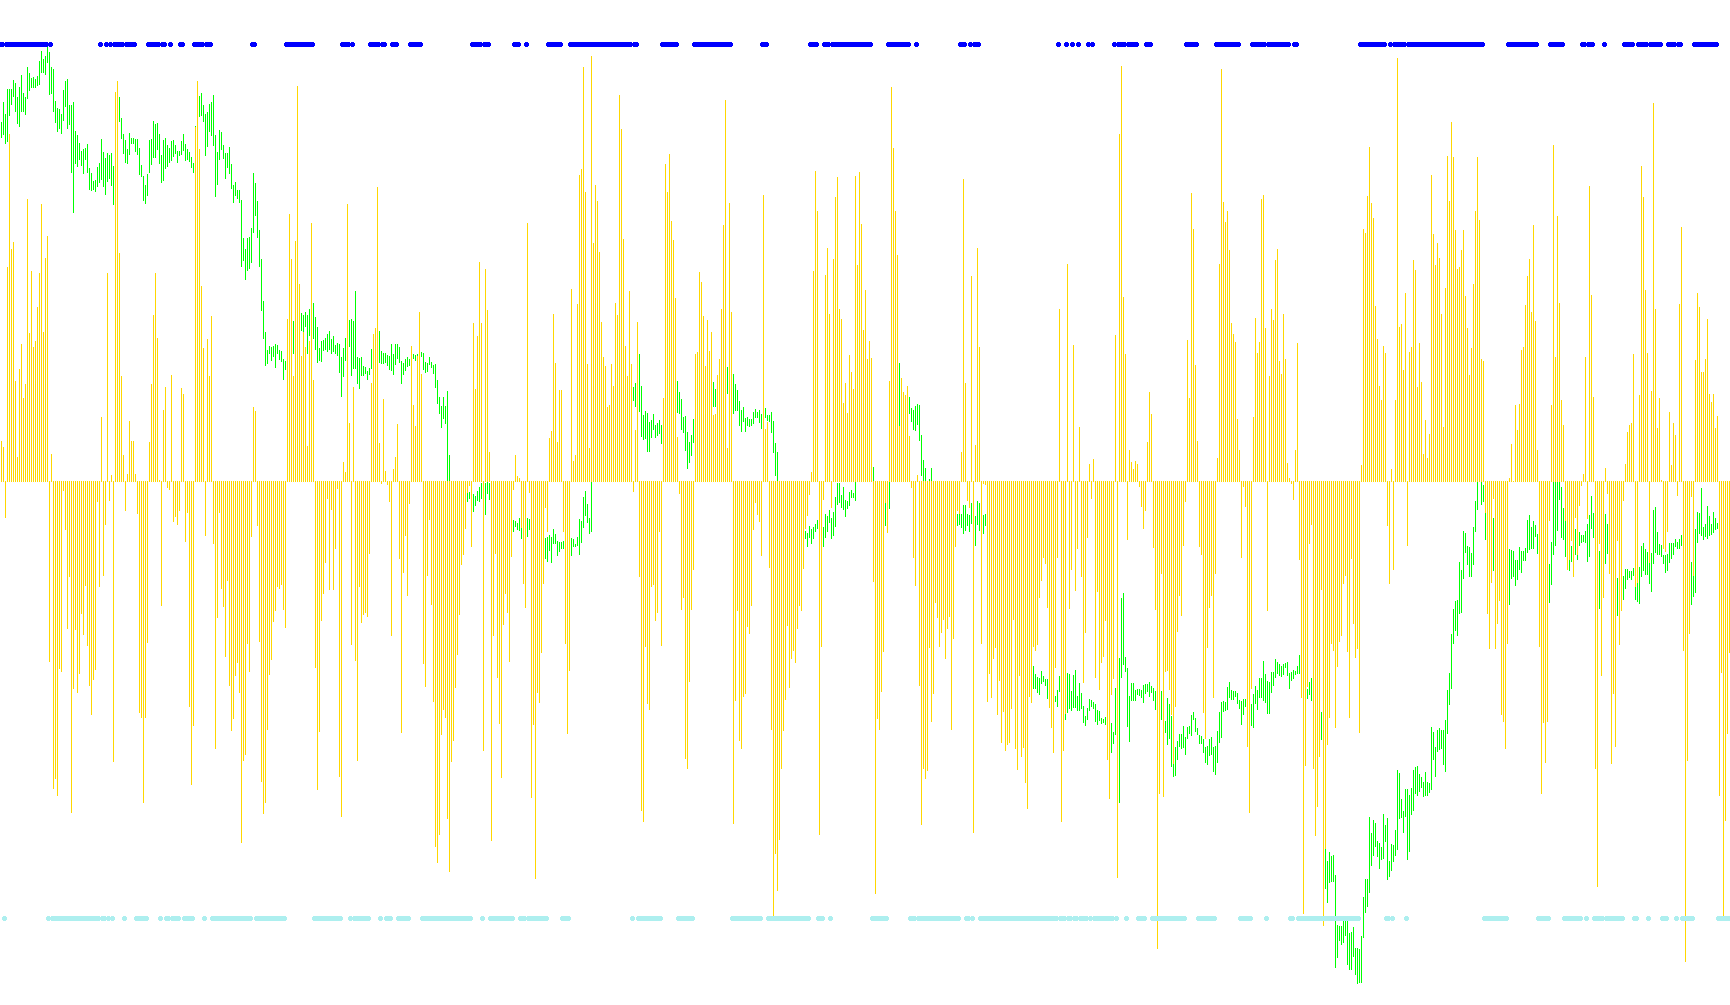
This tool is designed to provide visual market analysis by interpreting price action through the lens of volatility. Instead of appearing directly on your main price chart, it operates in a separate window below it, creating a distinct visual representation of market momentum and trend direction.
Core Logic and Functionality
The script functions by analyzing historical price data based on a user-defined timeframe (the Bollinger Period). It specifically focuses on the relationship between the current market price and the standard deviation—a measure of how much the price typically fluctuates from its average.
How it processes data:
- Volatility Calculation: The tool continuously calculates the "spread" or volatility of the market. It looks at the closing prices over a specific set of candles to determine how much the market is stretching.
- Normalized Scoring: The script takes this raw volatility and translates it into a mathematical score. This score determines whether the current price action is positioned significantly above or below its expected average relative to recent fluctuations.
- Visual Translation: Rather than just showing you raw numbers, the tool converts these scores into a histogram:
- Positive Momentum: When the calculation indicates that the price is moving with strength relative to its volatility, the indicator plots a positive value (represented by a specific color).
- Negative Momentum: When the calculation indicates the price is weakening or pulling back, it plots a negative value (represented by a different color).
User Experience
For the trader, this means the tool acts as a "sentiment gauge." By observing the direction and height of the histogram bars, you can get a clearer sense of whether the current market trend is accelerating in one direction or showing signs of exhaustion. It simplifies complex volatility math into a clean, color-coded visual that highlights where the price sits in relation to its standard movement patterns.
/*-----------------------------+
|			       |
| Shared by www.Aptrafx.com    |
|			       |
+------------------------------*/

//+------------------------------------------------------------------+
//|                                                      bbhisto.mq4 |
//|                                     Copyright © 2005, Nick Bilak |
//|        http://metatrader.50webs.com/         beluck[at]gmail.com |
//+------------------------------------------------------------------+
#property copyright "Copyright © 2005, Nick Bilak"
#property link      "http://metatrader.50webs.com/"

#property indicator_separate_window
#property indicator_buffers 3
#property indicator_color1 Lime
#property indicator_color2 Aqua
#property indicator_color3 Magenta
//---- input parameters
extern int bolingerPeriod=13;
//---- buffers
double bb[];
double up[];
double lo[];

int i,j;
//+------------------------------------------------------------------+
//| Custom indicator initialization function                         |
//+------------------------------------------------------------------+
int init()
  {
   SetIndexStyle(0,DRAW_HISTOGRAM);
   SetIndexBuffer(0,bb);
   SetIndexStyle(1,DRAW_ARROW);
   SetIndexBuffer(1,up);
   SetIndexEmptyValue(1,EMPTY_VALUE);
   SetIndexArrow(1,159);
   SetIndexStyle(2,DRAW_ARROW);
   SetIndexBuffer(2,lo);
   SetIndexEmptyValue(2,EMPTY_VALUE);
   SetIndexArrow(2,159);

   return(0);
  }
//+------------------------------------------------------------------+
//| Custor indicator deinitialization function                       |
//+------------------------------------------------------------------+
int deinit()
  {
//----

//----
   return(0);
  }
//+------------------------------------------------------------------+
//| Custom indicator iteration function                              |
//+------------------------------------------------------------------+
int start()
  {
   int counted_bars=IndicatorCounted();
   int shift,limit;
   double diff,d,ku,kd,km;

   if (counted_bars<0) return(-1);
   if (counted_bars>0) counted_bars--;
   limit=Bars-31;
   if(counted_bars>=31) limit=Bars-counted_bars-1;

   for (shift=limit+30;shift>=0;shift--)   {
      bb[shift]=0;
      d=iStdDev(NULL,0,bolingerPeriod,MODE_SMA,0,PRICE_CLOSE,shift);
      if( d<0.0001) d=0.0001;
      bb[shift]=((Close[shift]+2*d - iMA(NULL,0,bolingerPeriod,0,MODE_SMA,PRICE_CLOSE,shift)) /
         (4*d))*4-2;
      bb[shift]=bb[shift]/3;
      up[shift]=EMPTY_VALUE;
      lo[shift]=EMPTY_VALUE;
      if (bb[shift]>0) {
         up[shift]=1;
      }
      if (bb[shift]<0) {
         lo[shift]=-1;
      }

   }
   return(0);
  }
//+------------------------------------------------------------------+
Comments