bbsqueeze_003
Download script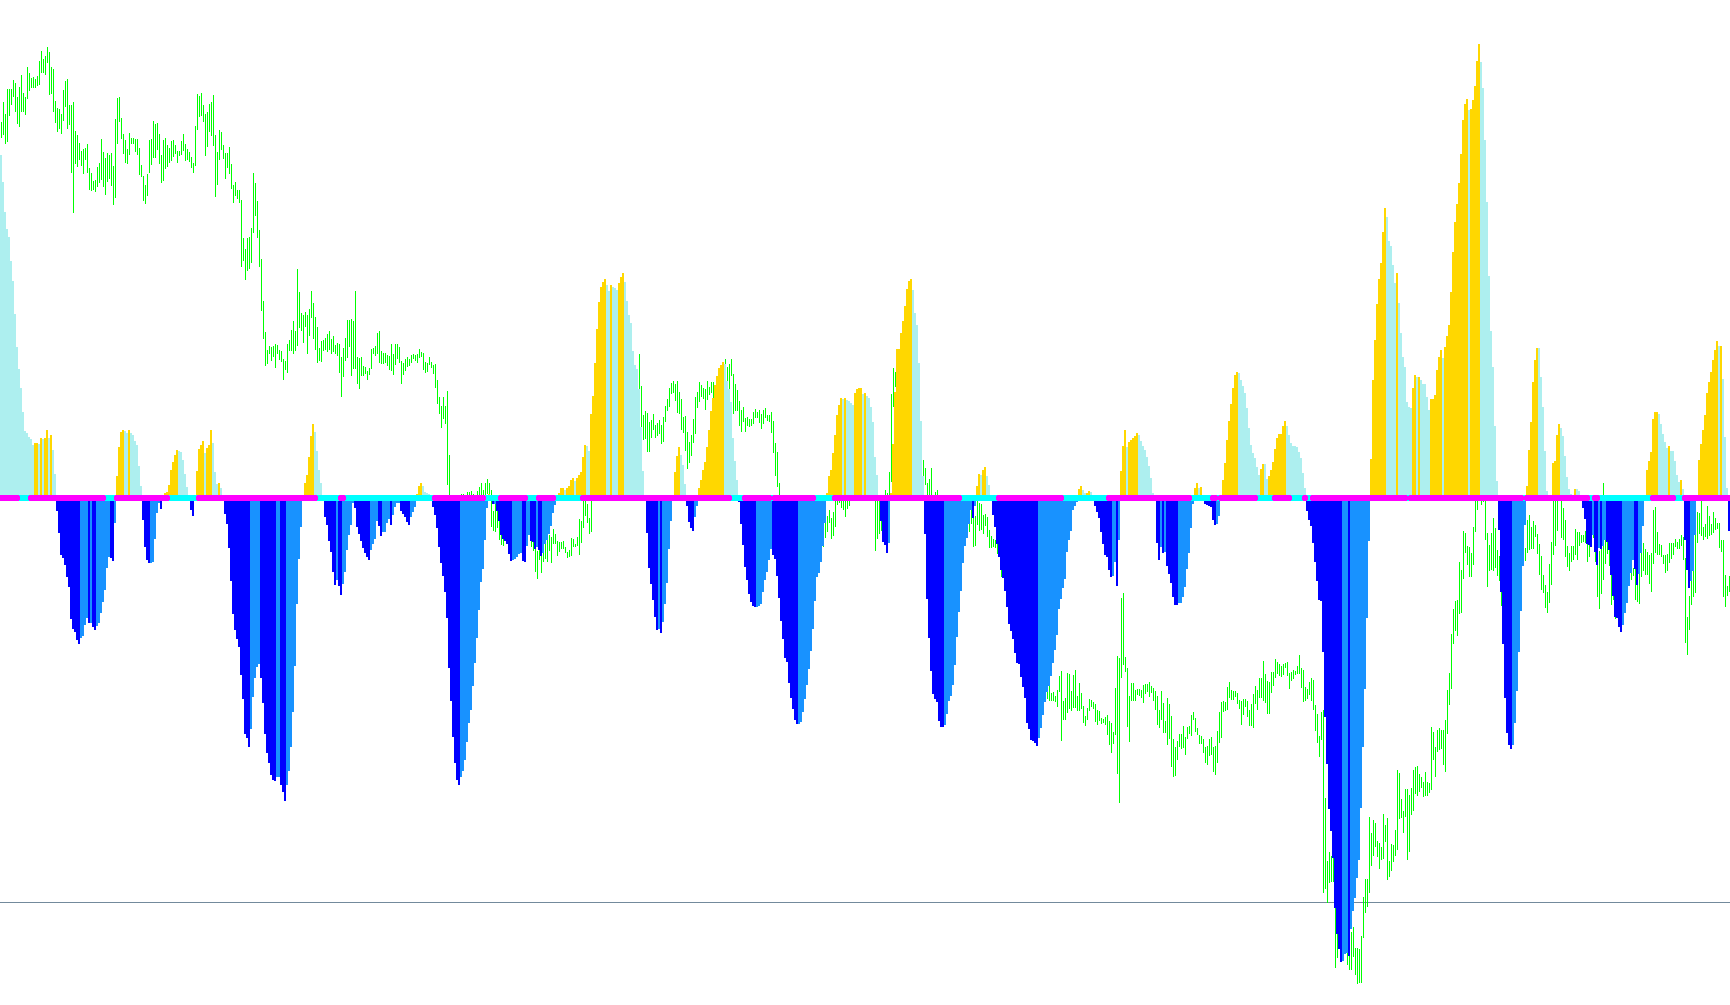
This technical script is designed to analyze market trends and volatility by identifying specific patterns in price movement. It works by combining three main analytical methods: linear regression, momentum tracking, and volatility comparison.
Here is a breakdown of the logic used:
1. Trend Direction Analysis
The script utilizes a custom "Linear Regression" calculation to determine the primary direction of the market. Unlike simple moving averages, this looks at the relationship between price levels and time to find a more stable trend line.
- Upward Momentum: The script tracks whether the current trend value is increasing or decreasing. If the trend is positive and rising, it highlights this as one type of movement; if it is positive but falling, it labels it differently.
- Downward Momentum: Conversely, it performs the same check for negative trend values to distinguish between a strengthening downward move and a weakening one.
2. Volatility Squeeze Detection
One of the primary functions of this script is to identify "squeezes"—periods where market volatility becomes unusually low before a potential breakout. To do this, it compares two different types of price behavior:
- Average True Range (ATR): This measures how much the price is moving on average over a set period.
- Standard Deviation: This measures how much the price deviates from its mean average.
By calculating the ratio between these two figures, the script determines if the market is in a "squeezed" state. When the volatility drops below a specific threshold (the squeeze), the indicator provides visual signals (arrows) to alert the user that a breakout might be imminent.
3. Visual Output
The script translates all this complex math into a clear visual interface for the trader:
- Histograms: These provide a continuous view of the trend's strength and direction, showing whether the market is currently leaning bullish or bearish.
- Arrows: These act as specific "alerts" on the chart. They appear when the volatility squeeze conditions are met, signaling to the user that the market environment has shifted from a quiet, compressed state to one ready for movement.
In summary, this tool helps a trader filter out market "noise" by identifying exactly when the price is trending in a specific direction and flagging those moments when volatility is at a low point, potentially preceding a significant move in either direction.
//+------------------------------------------------------------------+
//|                                                    bbsqueeze.mq4 |
//|                Copyright © 2005, Nick Bilak, beluck[AT]gmail.com |
//|           enhanced a little bit by CJ Rivas, carlos[AT]vealo.com |
//+------------------------------------------------------------------+
#property copyright "Copyright © 2005, Nick Bilak"
#property link      "http://metatrader.50webs.com/"

#property indicator_separate_window
#property indicator_buffers 6
#property indicator_color1 Blue
#property indicator_color2 Red
#property indicator_color3 DarkBlue
#property indicator_color4 Maroon
#property indicator_color5 Red
#property indicator_color6 Lime

//---- input parameters
extern int       bolPrd=20;
extern double    bolDev=2.0;
extern int       keltPrd=20;
extern double    keltFactor=1.5;
extern int       momPrd=12;
//---- buffers
double upB[];
double upB2[];
double loB[];
double loB2[];
double upK[];
double loK[];

int i,j,slippage=3;
double breakpoint=0.0;
double ema=0.0;
int peakf=0;
int peaks=0;
int valleyf=0;
int valleys=0, limit=0;
double ccis[61],ccif[61];
double delta=0;
double ugol=0;
//+------------------------------------------------------------------+
//| Custom indicator initialization function                         |
//+------------------------------------------------------------------+
int init()
  {
//---- indicators
   SetIndexStyle(0,DRAW_HISTOGRAM,EMPTY,3);
   SetIndexBuffer(0,upB);
   SetIndexEmptyValue(0,EMPTY_VALUE);

   SetIndexStyle(1,DRAW_HISTOGRAM,EMPTY,3);
   SetIndexBuffer(1,loB);
   SetIndexEmptyValue(1,EMPTY_VALUE);

   SetIndexStyle(4,DRAW_ARROW,EMPTY,2);
   SetIndexBuffer(4,upK);
   SetIndexEmptyValue(4,EMPTY_VALUE);
   SetIndexArrow(4,159);
   SetIndexStyle(5,DRAW_ARROW,EMPTY,2);
   SetIndexBuffer(5,loK);
   SetIndexEmptyValue(5,EMPTY_VALUE);
   SetIndexArrow(5,159);

   SetIndexStyle(2,DRAW_HISTOGRAM,EMPTY,3);
   SetIndexEmptyValue(2,EMPTY_VALUE);
   SetIndexBuffer(2,upB2);

   SetIndexStyle(3,DRAW_HISTOGRAM,EMPTY,3);
   SetIndexEmptyValue(3,EMPTY_VALUE);
   SetIndexBuffer(3,loB2);


//----
   return(0);
  }
//+------------------------------------------------------------------+
//| Custor indicator deinitialization function                       |
//+------------------------------------------------------------------+
int deinit()
  {
//----

//----
   return(0);
  }
//+------------------------------------------------------------------+
//| Custom indicator iteration function                              |
//+------------------------------------------------------------------+
int start()
  {
   int counted_bars=IndicatorCounted();
   int shift,limit;
   double diff,d,dPrev, std,bbs;

   if (counted_bars<0) return(-1);
   if (counted_bars>0) counted_bars--;
   limit=Bars-31;
   if(counted_bars>=31) limit=Bars-counted_bars-1;

   for (shift=limit;shift>=0;shift--)   {
      //d=iMomentum(NULL,0,momPrd,PRICE_CLOSE,shift);
      d=LinearRegressionValue(bolPrd,shift);
      dPrev=LinearRegressionValue(bolPrd,shift+1);
      if(d>0) {
         if ((dPrev>0) && (dPrev > d)){ upB2[shift]=d; upB[shift] = 0; } else { upB[shift]= d; upB2[shift] = 0; }
         //upB[shift]=0;
         loB[shift]=0;
         loB2[shift]=0;
      } else {
         if ((dPrev<0) && (dPrev < d)){ loB2[shift]=d; loB[shift] = 0; } else { loB[shift]= d; loB2[shift] = 0; }
         upB[shift]=0;
         upB2[shift]=0;
         //loB[shift]=d;
      }
		diff = iATR(NULL,0,keltPrd,shift)*keltFactor;
		std = iStdDev(NULL,0,bolPrd,MODE_SMA,0,PRICE_CLOSE,shift);
		bbs = bolDev * std / diff;
      if(bbs<1) {
         upK[shift]=0;
         loK[shift]=EMPTY_VALUE;
      } else {
         loK[shift]=0;
         upK[shift]=EMPTY_VALUE;
      }
   }
   return(0);
  }
//+------------------------------------------------------------------+


double LinearRegressionValue(int Len,int shift) {
   double SumBars = 0;
   double SumSqrBars = 0;
   double SumY = 0;
   double Sum1 = 0;
   double Sum2 = 0;
   double Slope = 0;

   SumBars = Len * (Len-1) * 0.5;
   SumSqrBars = (Len - 1) * Len * (2 * Len - 1)/6;

  for (int x=0; x<=Len-1;x++) {
   double HH = Low[x+shift];
   double LL = High[x+shift];
   for (int y=x; y<=(x+Len)-1; y++) {
     HH = MathMax(HH, High[y+shift]);
     LL = MathMin(LL, Low[y+shift]);
   }
    Sum1 += x* (Close[x+shift]-((HH+LL)/2 + iMA(NULL,0,Len,0,MODE_EMA,PRICE_CLOSE,x+shift))/2);
    SumY += (Close[x+shift]-((HH+LL)/2 + iMA(NULL,0,Len,0,MODE_EMA,PRICE_CLOSE,x+shift))/2);
  }
  Sum2 = SumBars * SumY;
  double Num1 = Len * Sum1 - Sum2;
  double Num2 = SumBars * SumBars-Len * SumSqrBars;

  if (Num2 != 0.0)  {
    Slope = Num1/Num2;
  } else {
    Slope = 0;
  }

  double Intercept = (SumY - Slope*SumBars) /Len;
  double LinearRegValue = Intercept+Slope * (Len - 1);

  return (LinearRegValue);

}
Comments