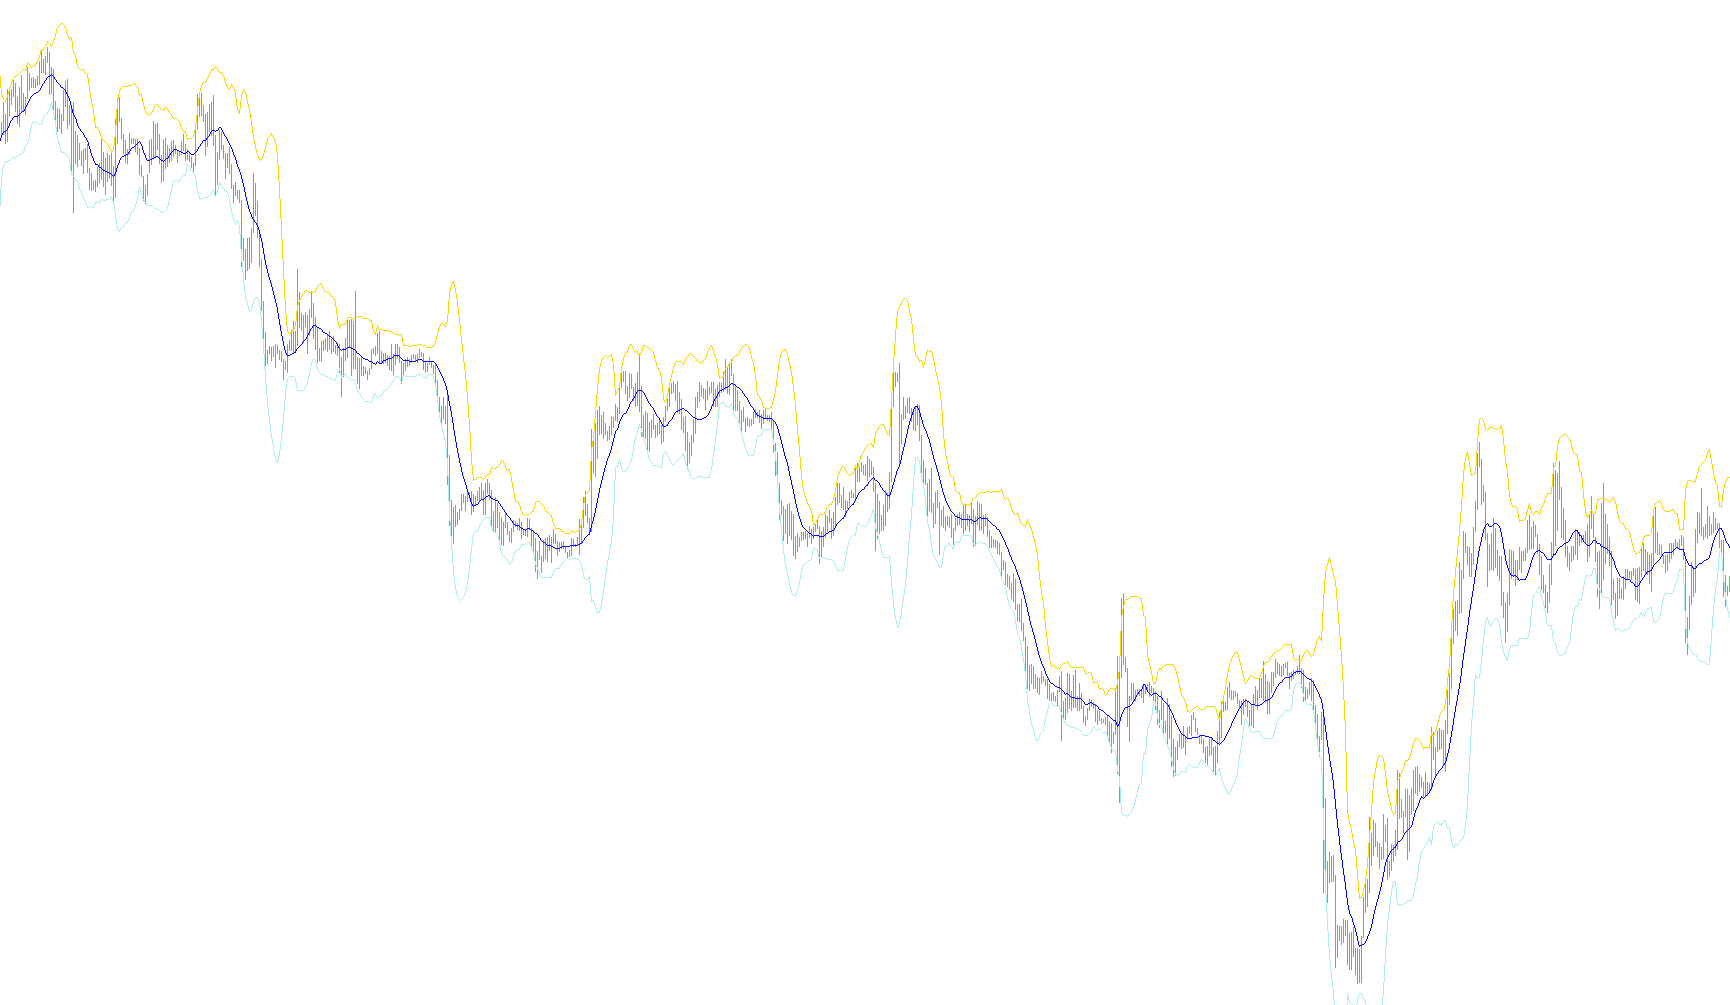
This tool is designed to help traders visualize price trends and identify potential overextended movements by combining two well-known market analysis concepts: Moving Averages and Standard Deviation.
How it Works
The logic follows a three-step process to generate the visual lines you see on your chart:
1. Establishing the Baseline (Moving Average) First, the script looks at a specific window of past price data (determined by the period setting). It calculates the average closing price over this timeframe to create a "middle line." This represents the general trend of the asset—whether it is currently moving upward, downward, or sideways.
2. Measuring Volatility (Standard Deviation) Next, the script calculates how much the price has been "swinging" away from that average. Instead of just looking at where the price is, it measures the intensity of the movement. If the price stays very close to the average, the volatility is low; if the price makes large, sharp swings, the volatility is high.
3. Creating the Dynamic Boundaries (Fractal Deviation) Finally, the script takes that measurement of volatility and multiplies it by a specific "Deviation" factor. It then projects this value both above and below the middle line.
This results in three distinct lines on your chart:
- The Center Line: The smoothed average price.
- The Upper Boundary: The average price plus the volatility (multiplied by your chosen factor).
- The Lower Boundary: The average price minus the volatility (multiplied by your chosen factor).
What this means for your trading
Instead of using fixed price levels, this tool creates "elastic" boundaries. When the market becomes more volatile, the boundaries expand; when the market calms down, the boundaries contract. This allows you to see when the price is pushing significantly far away from its normal behavior, potentially signaling that the market is overextended and may be due for a correction or a trend reversal.
//+------------------------------------------------------------------+
//|                                               BBwithFractdev.mq4 |
//|                                           Êèì Èãîðü Â. aka KimIV |
//|                                              http://www.kimiv.ru |
//|                                                                  |
//| Ïîëîñû Áîëëèíäæåðà ñ äðîáíûì êîýôôèöèåíòîì îòêëîíåíèÿ            |
//+------------------------------------------------------------------+
#property copyright "Êèì Èãîðü Â. aka KimIV"
#property link      "http://www.kimiv.ru"

#property indicator_chart_window
#property indicator_buffers 3
#property indicator_color1 Green
#property indicator_color2 Blue
#property indicator_color3 Green

//---- input parameters
extern int    BB_Period = 13;     // Ïåðèîä ñðåäíåé è îòêëîíåíèÿ
extern double Deviation = 2.618;  // Êîýôôèöèåíò îòêëîíåíèÿ

//---- indicator buffers
double buf1[];
double buf2[];
double buf3[];

//+------------------------------------------------------------------+
//| Custom indicator initialization function                         |
//+------------------------------------------------------------------+
void init() {
  SetIndexStyle(0, DRAW_LINE);
  SetIndexStyle(1, DRAW_LINE);
  SetIndexStyle(2, DRAW_LINE);
  IndicatorDigits(MarketInfo(Symbol(), MODE_DIGITS));

  SetIndexBuffer(0, buf1);
  SetIndexBuffer(1, buf2);
  SetIndexBuffer(2, buf3);
}

//+------------------------------------------------------------------+
//| Custom indicator iteration function                              |
//+------------------------------------------------------------------+
void start() {
  int i, j;
  double ave, sko, sum;

  if (Bars<=BB_Period) return;
  for (i=Bars-BB_Period; i>=0; i--) {
    buf2[i] = iMA(NULL,0,BB_Period,0,MODE_SMA,PRICE_CLOSE,i);
    sum = 0;
    for (j=0; j<BB_Period; j++) sum+=Close[i+j];
    ave = sum / BB_Period;
    sum = 0;
    for (j=0; j<BB_Period; j++) sum+=(Close[i+j]-ave)*(Close[i+j]-ave);
    sko = MathSqrt(sum / BB_Period);
    buf1[i] = buf2[i]+(Deviation*sko);
    buf3[i] = buf2[i]-(Deviation*sko);
  }
}
//+------------------------------------------------------------------+
Comments