bias
Download script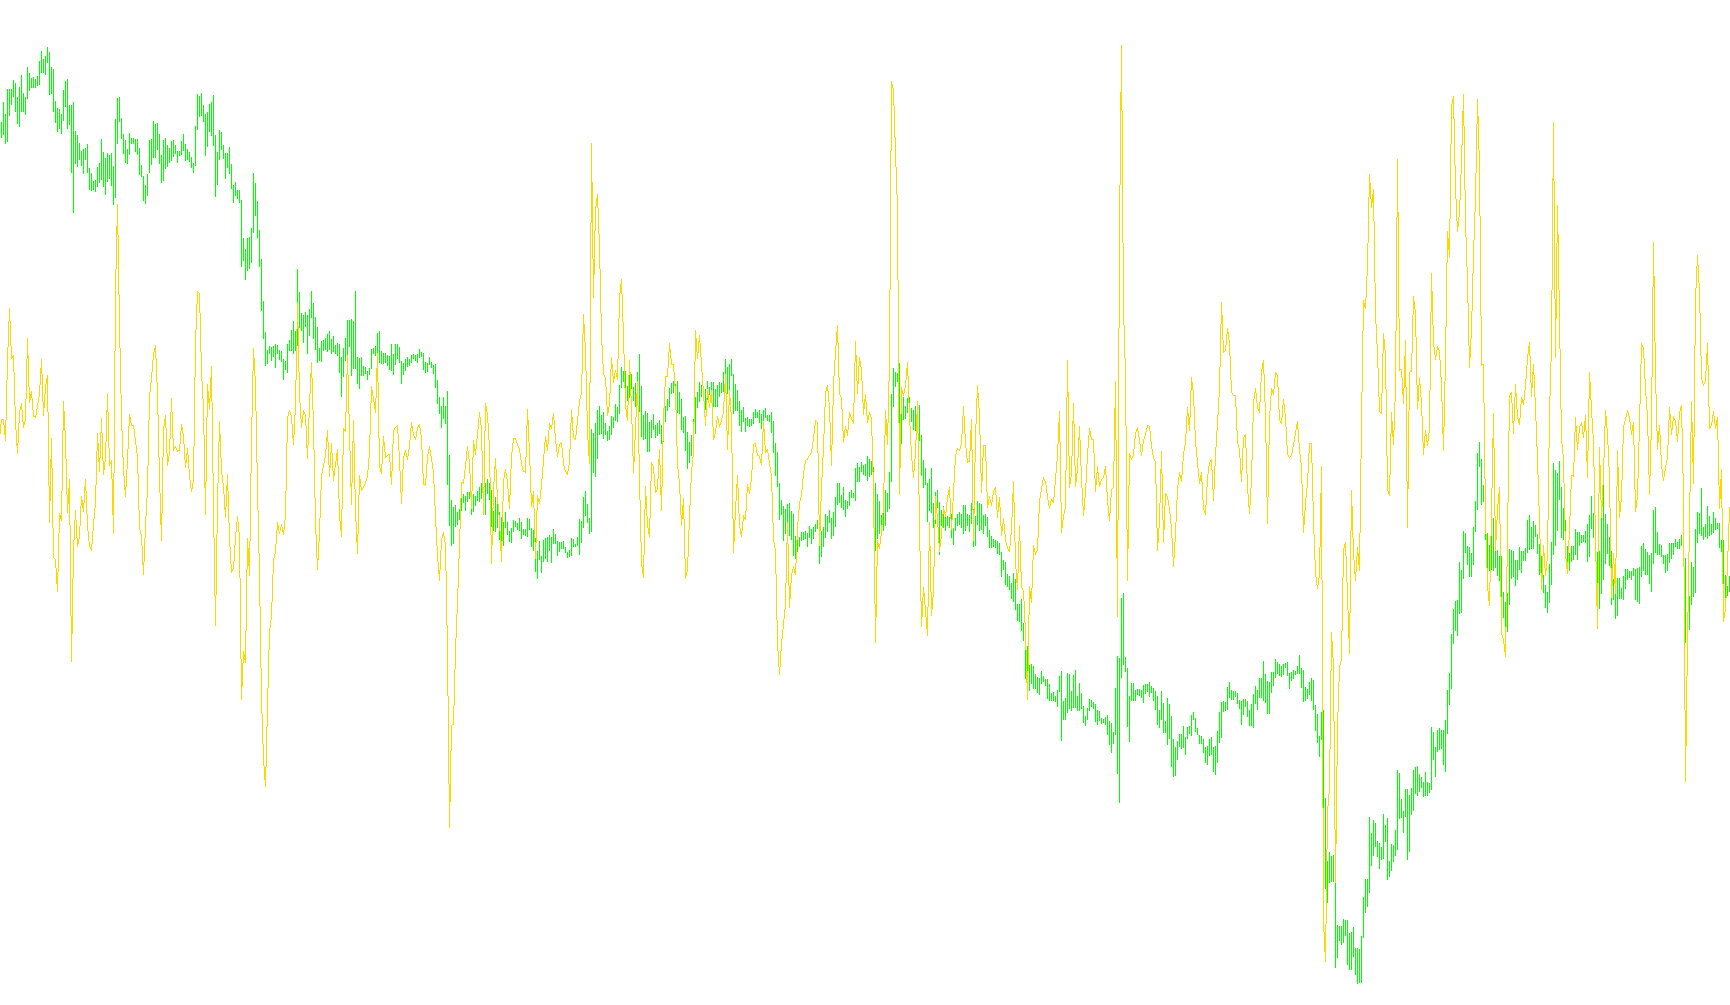
This script is designed to act as a visual guide for traders to understand the "momentum" or "bias" of a financial asset. Instead of just looking at the raw price, it helps identify whether the current market price is trending above or below its expected average, providing a clearer picture of the prevailing trend.
How the Logic Works
The indicator operates by comparing two specific data points: the current market price and a smoothed moving average. Here is the step-by-step breakdown of that logic:
1. Establishing the Baseline (Moving Average) The script first calculates a "Moving Exponential Average" based on a specific timeframe (determined by the user). This average acts as a baseline, representing the "smoothed" price history over a set number of periods. Because it is an exponential average, it gives more importance to recent price action than older data.
2. Calculating the Deviation Once the baseline is established, the script looks at the current closing price of the asset. It calculates the difference between that actual price and the moving average value calculated in the previous step.
3. Determining the Bias Percentage The final calculation converts that raw difference into a relative percentage. By dividing the difference by the actual price, the script determines how far the price has strayed from its average relative to its total value.
What This Means for the Trader
The result is displayed as a line in a separate window at the bottom of your trading chart. This line tells you the following:
- Positive Bias: When the line moves above zero, it indicates that the current price is higher than the moving average. This suggests bullish momentum, where the market is currently pushing upward relative to its recent history.
- Negative Bias: When the line drops below zero, it indicates that the price is lower than the moving average. This suggests bearish momentum, suggesting a downward trend.
- Strength of Trend: The further the line moves away from the zero mark (in either direction), the stronger the deviation from the average. If the line stays close to zero, it suggests the market is consolidating or moving sideways with little conviction.
By using this tool, you can quickly visualize whether the "bias" of the market is currently favoring the upside or the downside, helping to filter out minor price fluctuations and focus on the broader trend.
//+------------------------------------------------------------------+
//|                                                         bias.mq4 |
//|                       Copyright ?2008, MetaQuotes Software Corp. |
//|                                        http://www.metaquotes.net |
//+------------------------------------------------------------------+
#property copyright "Copyright ?2008, MetaQuotes Software Corp."
#property link      "http://www.metaquotes.net"

#property indicator_separate_window
#property indicator_buffers 1
#property indicator_color1 Silver

//---- input parameters
extern int       MAPeriod=9;

//---- buffers
double ind_buffer[];
double BiasBuffer[];

//+------------------------------------------------------------------+
//| Custom indicator initialization function                         |
//+------------------------------------------------------------------+
int init()
  {
   IndicatorBuffers(2);
   SetIndexBuffer(0, BiasBuffer);
   SetIndexBuffer(1, ind_buffer);

//---- indicators
   SetIndexStyle(0,DRAW_LINE);
   SetIndexBuffer(0,BiasBuffer);

//---- name for DataWindow and indicator subwindow label
   IndicatorShortName("BIAS("+MAPeriod+")");
   SetIndexLabel(0,"BIAS");

//----
   SetIndexDrawBegin(0,MAPeriod);
   return(0);
//----
   }
//+------------------------------------------------------------------+
//| Custor indicator deinitialization function                       |
//+------------------------------------------------------------------+
int deinit()
  {
//----

//----
   return(0);
  }
//+------------------------------------------------------------------+
//| Custom indicator iteration function                              |
//+------------------------------------------------------------------+
int start()
  {
   int    counted_bars=IndicatorCounted();
   int i;

//----
   if(Bars<=MAPeriod) return(0);

//---- initial zero
   if(counted_bars<1)
      for(i=1;i<=MAPeriod;i++) BiasBuffer[Bars-i]=0.0;
//----
   i=Bars-MAPeriod-1;
   if(counted_bars>=MAPeriod) i=Bars-counted_bars-1;
   while(i>=0)
     {ind_buffer[i]=iMA(NULL,0,MAPeriod,0,MODE_EMA,PRICE_CLOSE,i);
      BiasBuffer[i]=(Close[i]-ind_buffer[i])/Close[i];
      i--;
     }

//----
   return(0);
  }

//+------------------------------------------------------------------+
Comments