BLines_Profi_en_001
Download script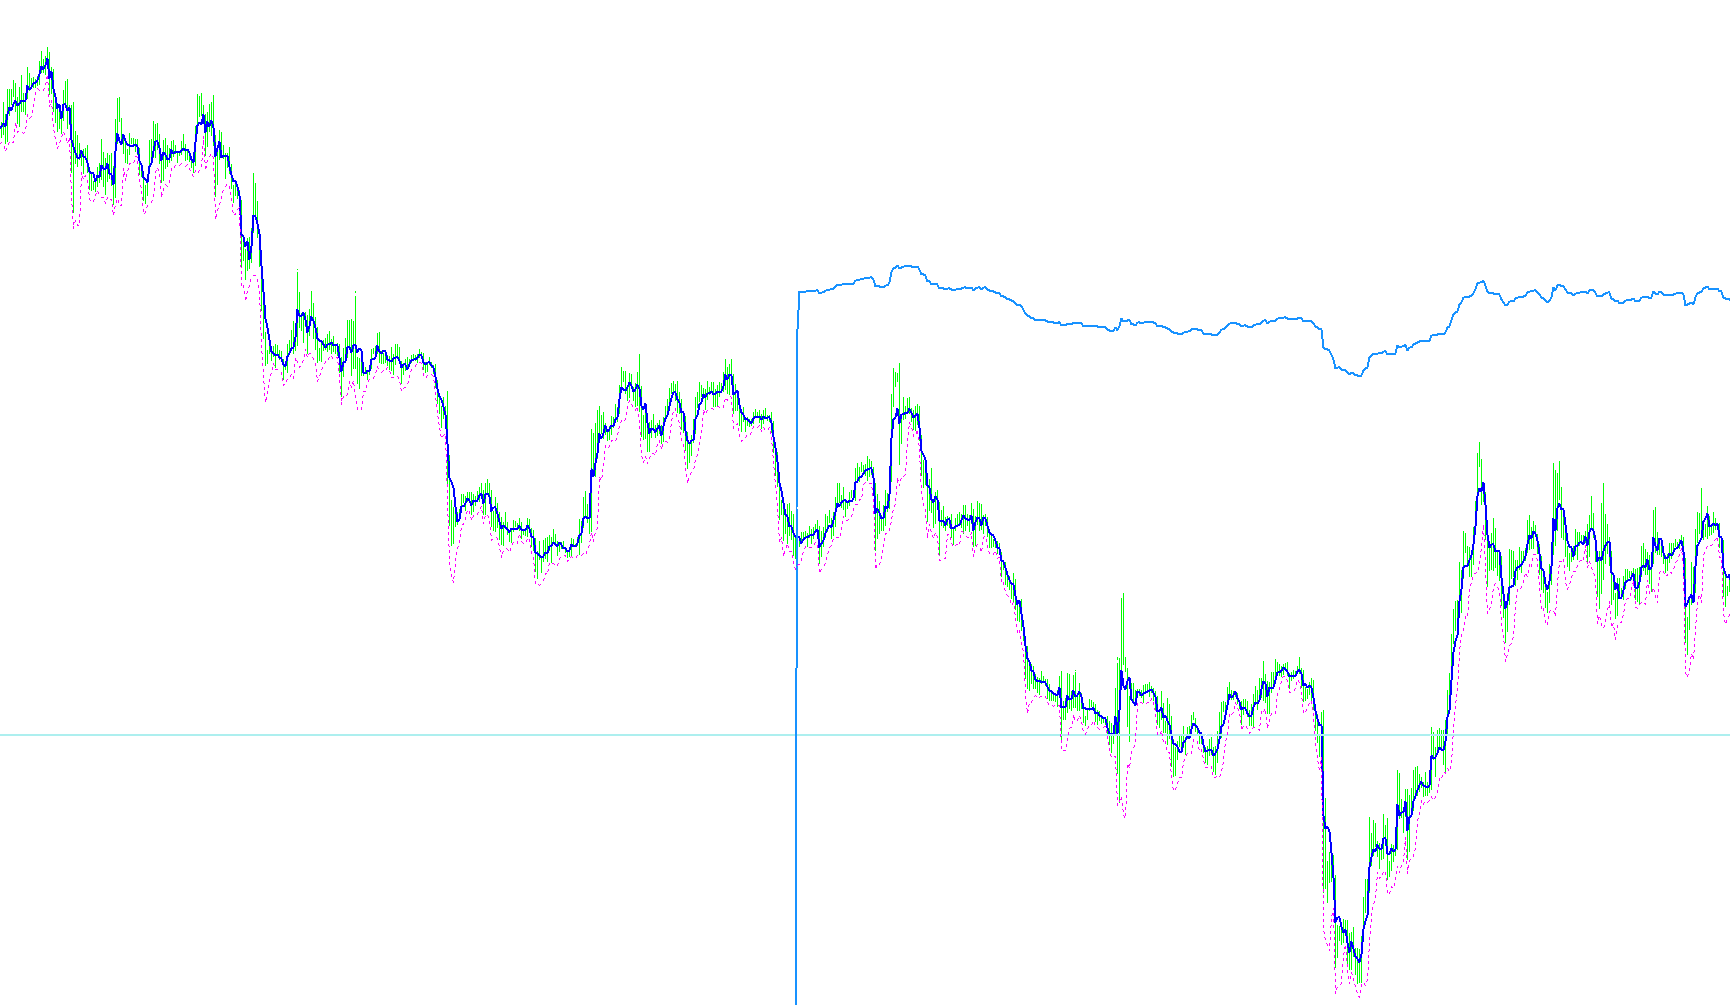
This script is designed to provide traders with a visual representation of "Balance Lines" on a trading chart. It calculates specific price levels based on historical data, identifying areas where the market may be finding equilibrium, as well as potential support and resistance zones.
The logic operates through several key components:
Multi-Timeframe Analysis
The script does not look at the current chart in isolation. It is designed to pull data from a higher time frame (defined by the user) and project it onto the current view. This allows traders to see "big picture" price structures while looking at smaller, more granular movements. It automatically aligns these larger time frames with the current chart to ensure the data remains consistent.
Balance Points and Equilibrium
The core functionality revolves around identifying "Balance Points." The script calculates these by analyzing the high, low, and closing prices of specific historical periods.
- Static vs. Dynamic: It distinguishes between static levels (fixed points in time) and dynamic levels (levels that shift as new data arrives).
- Center Point Calculation: It identifies a central balance price, which acts as a pivot for the surrounding market activity.
Support and Resistance Levels
Beyond just finding the center of balance, the script uses a Fibonacci-based calculation to project support and resistance levels. By taking the distance between the high and low of a period and applying a specific percentage (defaulting to 61.8%), it draws lines that represent potential areas where price might stall or reverse.
Stepped Averaging
To provide a smoother and more comprehensive view of market sentiment, the script calculates "Balance Steps." Instead of relying on a single data point, it averages several periods together. This creates a "stepped" effect, helping to filter out minor market noise and highlight more significant structural shifts in price.
Visual Organization
The script organizes all this information into eight distinct visual buffers:
- Two lines for the Static Balance levels (Support and Resistance).
- Two lines for the Dynamic Balance levels (Support and Resistance).
- Two sets of lines representing the Step averages for both Static and Dynamic calculations.
By combining these elements, the script provides a comprehensive map of market equilibrium, highlighting where price is balanced and where it might face significant hurdles or find new support.
//+------------------------------------------------------------------+
//|                                              BLines_Profi_v1.mq4 |
//|                                                          Profi_R |
//+------------------------------------------------------------------+
#property copyright "Copyright © 2005, MetaQuotes Software Corp."
#property link      "Profi_R"

#property indicator_chart_window
#property indicator_buffers 8
#property indicator_color1 Blue
#property indicator_color2 DodgerBlue
#property indicator_color3 Yellow
#property indicator_color4 Yellow
#property indicator_color5 Black
#property indicator_color6 White
#property indicator_color7 Black
#property indicator_color8 White
//---- input parameters
extern int       Range=5;
extern int       NextTF=240;
extern double    FiboLevel=0.618;
//---- buffers
double StBPoint[];
double DBPoint[];
double StBStep[];
double DBStep[];
double StSupport[];
double DSupport[];
double StResistance[];
double DResistance[];
//----
int d_b,Displacement;

//+------------------------------------------------------------------+
//| Custom indicator initialization function                         |
//+------------------------------------------------------------------+
int init()
  {
//---- indicators
   SetIndexStyle(0,DRAW_LINE,STYLE_SOLID,2);
   SetIndexStyle(1,DRAW_LINE,STYLE_SOLID,2);
   SetIndexStyle(2,DRAW_LINE,STYLE_SOLID,2);
   SetIndexStyle(3,DRAW_LINE,STYLE_SOLID,2);
   SetIndexStyle(4,DRAW_LINE,STYLE_DOT);
   SetIndexStyle(5,DRAW_LINE,STYLE_DOT);
   SetIndexStyle(6,DRAW_LINE,STYLE_DOT);
   SetIndexStyle(7,DRAW_LINE,STYLE_DOT);
   SetIndexBuffer(0,StBPoint);
   SetIndexBuffer(1,DBPoint);
   SetIndexBuffer(2,StBStep);
   SetIndexBuffer(3,DBStep);
   SetIndexBuffer(4,StSupport);
   SetIndexBuffer(5,DSupport);
   SetIndexBuffer(6,StResistance);
   SetIndexBuffer(7,DResistance);
   SetIndexLabel(0,"Static level of balance");
   SetIndexLabel(1,"Dynamic level of balance");
   SetIndexLabel(2,"Static steps of balance");
   SetIndexLabel(3,"Dynamic steps of balance");
   SetIndexLabel(4,"Static level of support (Fibo"+FiboLevel*100+"%)");
   SetIndexLabel(5,"Dynamic level of support (Fibo"+FiboLevel*100+"%)");
   SetIndexLabel(6,"Static level of resistance (Fibo"+FiboLevel*100+"%)");
   SetIndexLabel(7,"Dynamic level of resistance (Fibo"+FiboLevel*100+"%)");
   string short_name;
   short_name="Lines of balance ("+Range+","+NextTF+","+FiboLevel*100+")";
   IndicatorShortName(short_name);
   if( NextTF>Period() )
   {
      d_b=Range*NextTF/Period();
      if( NextTF<10080)
      {
         Displacement=NextTF/Period();
      }
      else
      {
         if( NextTF==10080 )
         {
            Displacement=7200/Period();
         }
         else
         {
            if( NextTF==43200 )
            {
               Displacement=31680/Period();
            }
         }
      }
   }
   else
   {
      return(-1);
   }
   SetIndexDrawBegin(0,d_b);
   SetIndexDrawBegin(1,d_b);
   SetIndexDrawBegin(2,d_b);
   SetIndexDrawBegin(3,d_b);
   SetIndexDrawBegin(4,d_b);
   SetIndexDrawBegin(5,d_b);
   SetIndexDrawBegin(6,d_b);
   SetIndexDrawBegin(7,d_b);
   SetIndexShift(0,Displacement);
   SetIndexShift(2,Displacement);
   SetIndexShift(4,Displacement);
   SetIndexShift(6,Displacement);
//----
   return(0);
  }
//+------------------------------------------------------------------+
//| Custom indicator iteration function                              |
//+------------------------------------------------------------------+
int start()
  {
   int cb,limit,sbb_index,sbb_Aux_i,sbe_Aux_i,i;
   int counted_bars=IndicatorCounted();
   datetime Corresp_bbbnTime;
   double StHigh,StLow,DHigh,DLow,SStBStep,SDBStep;
//----
   if( NextTF<=Period() )
   {
      Alert("Incorrect parameter NextTF, it should be more current TF!");
      return(-1);
   }
   if( counted_bars<0 )
   {
      return(-1);
   }
   else
   {
      if( Bars-1-counted_bars>Bars-1-d_b )
      {
         limit=Bars-1-d_b;
      }
      else
      {
         if( Bars-1-counted_bars>=0 )
         {
            limit=Bars-1-counted_bars;
         }
         else
         {
            limit=0;
         }
      }
   }
   limit=Bars-1-counted_bars;
//----
   for(cb=limit;cb>=0;cb--)
   {
      Corresp_bbbnTime=NormTimeBarBegin(Time[cb],NextTF);
      sbb_index=n_iBarShift(Corresp_bbbnTime,Period());
      StHigh=High[Highest(NULL,0,MODE_HIGH,sbb_index-cb+1,cb)];
      StLow=Low[Lowest(NULL,0,MODE_LOW,sbb_index-cb+1,cb)];
      StBPoint[cb]=MathRound((Close[cb]+StHigh+StLow)/3/Point)*Point;
      StSupport[cb]=StBPoint[cb]-MathRound((StHigh-StLow)*FiboLevel/Point)*Point;
      StResistance[cb]=StBPoint[cb]+MathRound((StHigh-StLow)*FiboLevel/Point)*Point;
      if( cb<sbb_index )
      {
         for(i=cb+1;i<=sbb_index;i++)
         {
            StBPoint[i]=StBPoint[cb];
            StSupport[i]=StSupport[cb];
            StResistance[i]=StResistance[cb];
         }
      }
      DHigh=High[Highest(NULL,0,MODE_HIGH,Displacement,cb)];
      DLow=Low[Lowest(NULL,0,MODE_LOW,Displacement,cb)];
      DBPoint[cb]=MathRound((Close[cb]+DHigh+DLow)/3/Point)*Point;
      DSupport[cb]=DBPoint[cb]-MathRound((DHigh-DLow)*FiboLevel/Point)*Point;
      DResistance[cb]=DBPoint[cb]+MathRound((DHigh-DLow)*FiboLevel/Point)*Point;
      SStBStep=StBPoint[cb];
      sbe_Aux_i=sbb_index+1;
      for(i=1;i<Range;i++)
      {
         Corresp_bbbnTime=NormTimeBarBegin(Time[sbe_Aux_i],NextTF);
         sbb_Aux_i=n_iBarShift(Corresp_bbbnTime,Period());
         SStBStep+=StBPoint[sbb_Aux_i];
         sbe_Aux_i=sbb_Aux_i+1;
      }
      StBStep[cb]=MathRound(SStBStep/Range/Point)*Point;
      if( cb<sbb_index )
      {
         for(i=cb+1;i<=sbb_index;i++)
         {
            StBStep[i]=StBStep[cb];
         }
      }
      SDBStep=DBPoint[cb];
      datetime sbbt_dif,bbbt_aux_b,bbbt_aux_s,t_aux;
      int i_aux;
      sbbt_dif=NormTimeBarBegin(Time[cb],Period())-NormTimeBarBegin(Time[cb],NextTF);
      for(i=1;i<Range;i++)
      {
         bbbt_aux_b=NormTimeBarBegin(iTime(NULL,NextTF,n_iBarShift(Time[cb],NextTF)+i),NextTF);
         bbbt_aux_s=NormTimeBarBegin(Time[cb+i*Displacement],NextTF);
         if( bbbt_aux_b!=bbbt_aux_s )
         {
            t_aux=MathMax(bbbt_aux_b,bbbt_aux_s);
            i_aux=n_iBarShift(t_aux+sbbt_dif,Period());
         }
         else
         {
            i_aux=n_iBarShift(bbbt_aux_b+sbbt_dif,Period());
         }
         SDBStep+=DBPoint[i_aux];
      }
      DBStep[cb]=MathRound(SDBStep/Range/Point)*Point;
   }
//----
   return(0);
  }

datetime NormTimeBarBegin(datetime intime, int TF)
  {
//----
   datetime outtime;
   if(TF!=10080)
   {
      outtime=MathFloor(intime/TF/60)*TF*60;
   }
   else
   {
      outtime=MathFloor((intime+345600)/TF/60)*TF*60-345600;
   }

//----
   return(outtime);
  }

int n_iBarShift(datetime intime, int TF)
  {
//----
   int bindex,b_count;
   datetime TArray[];
   b_count=ArrayCopySeries(TArray,MODE_TIME,Symbol(),TF);
   if( b_count<1 )
   {
      Alert("Íåõâàòêà äàííûõ!");
   }
   else
   {
      bindex=ArrayBsearch(TArray,NormTimeBarBegin(intime,TF),0,0,MODE_ASCEND) ;
   }
//----
   return(bindex);
  }
Comments