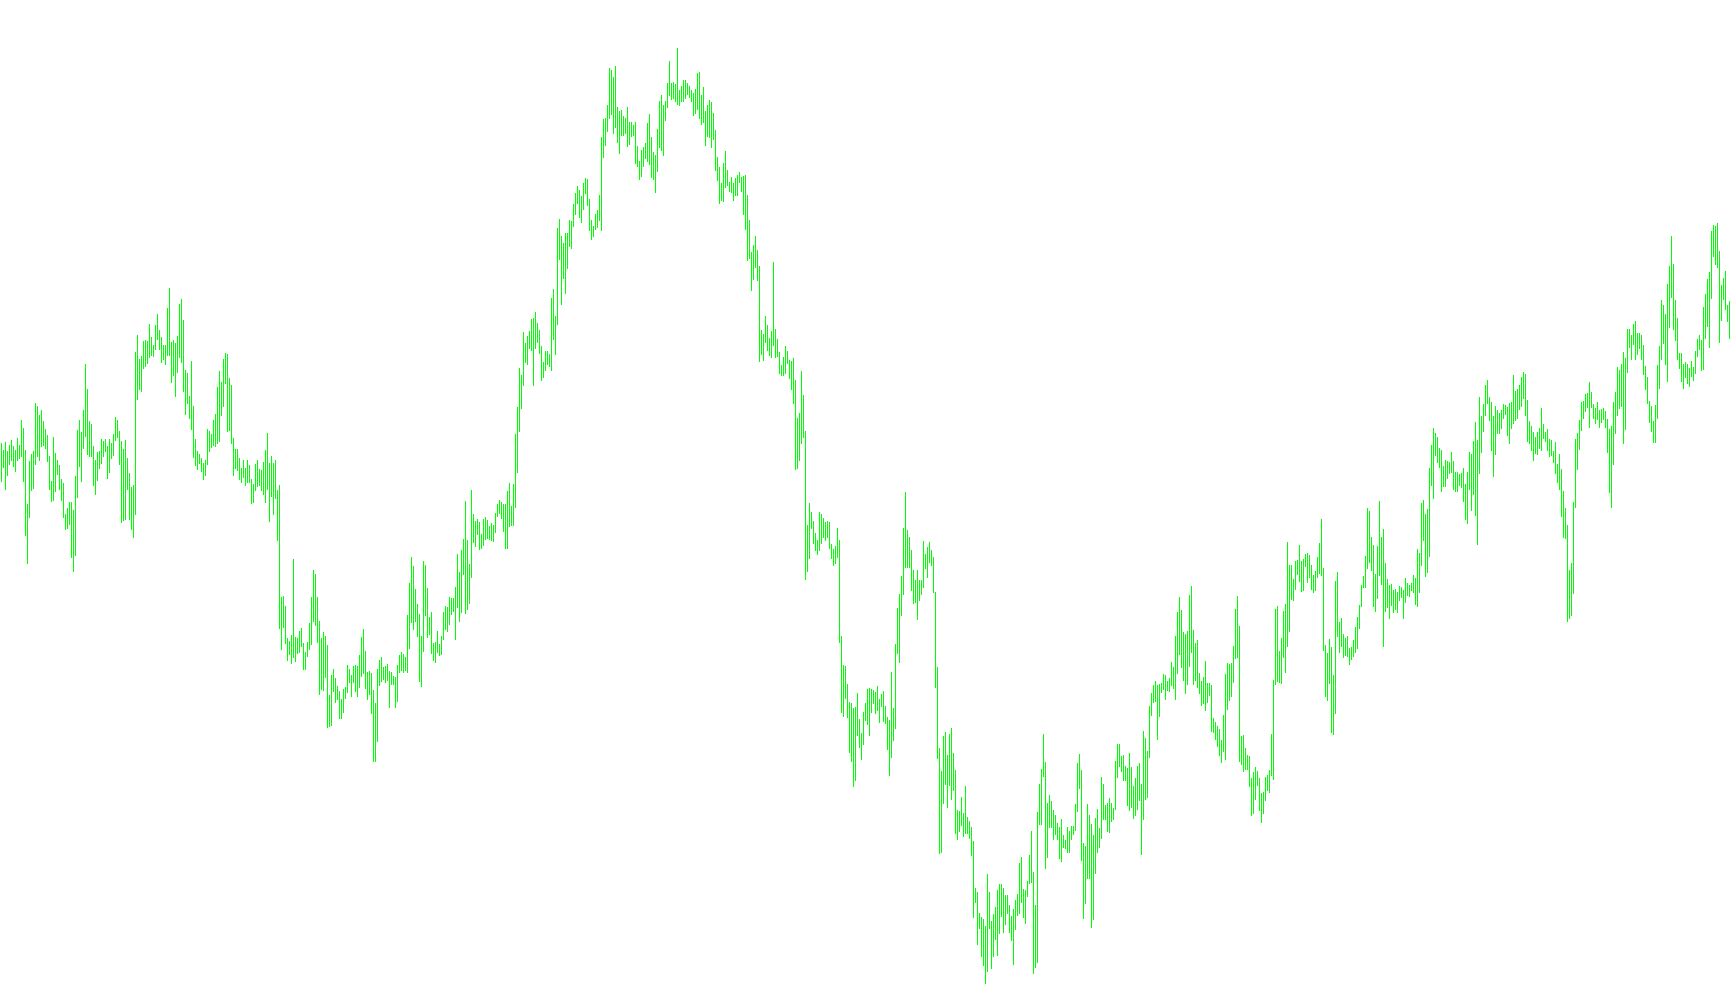
This tool is designed to provide a visual representation of current market liquidity and pricing dynamics directly on your trading chart. Rather than just showing you a single price point, it creates a dynamic visual "zone" that helps you see the immediate gap between what buyers are offering and what sellers are demanding.
How the Logic Works
1. Real-Time Data Collection The script constantly monitors three core pieces of information from the live market:
- The Bid Price: The current price at which the market is willing to buy.
- The Ask Price: The current price at which the market is willing to sell.
- The Spread: The mathematical difference between the Buy and Sell prices (the "cost" of entering a trade).
2. Dynamic Time Scaling One of the key features of this script is its ability to adapt to your specific view. It automatically detects which timeframe you are currently looking at (e.g., 1 minute, 5 minutes, 1 hour, etc.). It then calculates a proportional time window based on that period. This ensures that the visual information stays relevant and proportionate whether you are doing high-frequency scalping or long-term trend analysis.
3. Visual Mapping Once the data is collected, the script draws three distinct elements on your screen:
- Price Zones: It generates blue rectangular blocks that occupy the space between the Bid and Ask prices. These provide a clear visual "buffer zone," helping you see the immediate volatility of the market spread.
- Projections: The script projects these zones forward into the future based on the time scales mentioned above, giving you a sense of the current price area's footprint.
- Spread Indicator: It places a text label on the chart that calculates and displays the current spread. This allows you to monitor at a glance how "tight" or "wide" the market is moving, which is essential for understanding trading costs and market activity levels.
Summary for the User
In simple terms, this script turns raw numbers into a visual map. Instead of squinting at price digits, you get a colored representation of the "market gap." It helps you see the "thickness" of the current price action and provides an instant readout of the spread, adjusting its proportions automatically to match whichever chart timeframe you have open.
//+------------------------------------------------------------------+
//|                                                      Blue_Spread |
//|                                      Copyright 2015, SelfTraders |
//|                                               http://www.stfx.tk |
//+------------------------------------------------------------------+
#property copyright "SelfTraders"
#property link      "http://www.stfx.tk"
#property indicator_chart_window

int init  (){return(0);}
int deinit(){Comment("");ObjectDelete("RT1");ObjectDelete("RT2");ObjectDelete("RT3");return(0);}
//+------------------------------------------------------------------+
//|                                                                  |
//+------------------------------------------------------------------+
int start ()
  {
   Comment("");ObjectDelete("RT1");ObjectDelete("RT2");ObjectDelete("RT3");
   double MBID=MarketInfo(Symbol(),MODE_BID   );
   double MASK=MarketInfo(Symbol(),MODE_ASK   );
   double MSPR=MarketInfo(Symbol(),MODE_SPREAD);
   double timeX;
   if(Period()==1   )timeX=60;if(Period()==5    )timeX=300;if(Period()==15   )timeX=900;
   if(Period()==30  )timeX=1800;if(Period()==60   )timeX=3600;if(Period()==240  )timeX=14400;
   if(Period()==1440)timeX=86400;if(Period()==10080)timeX=604800;if(Period()==43200)timeX=2592000;
   ObjectCreate("RT1",OBJ_RECTANGLE,0,Time[3000]+timeX/2,MBID,TimeCurrent()+timeX*5,MASK);
   ObjectSet("RT1",OBJPROP_COLOR,Blue);
   ObjectCreate("RT2",OBJ_RECTANGLE,0,TimeCurrent()+timeX*5,MBID,TimeCurrent()+timeX*1000,MASK);
   ObjectSet("RT2",OBJPROP_COLOR,DarkBlue);
   ObjectCreate("RT3",OBJ_TEXT,0,TimeCurrent()+timeX*10,(4*MASK+MBID)/5);
   ObjectSetText("RT3",DoubleToStr(MSPR/10,1),8,"Lucida console",White);
   return(0);
  }
//+------------------------------------------------------------------+
Comments