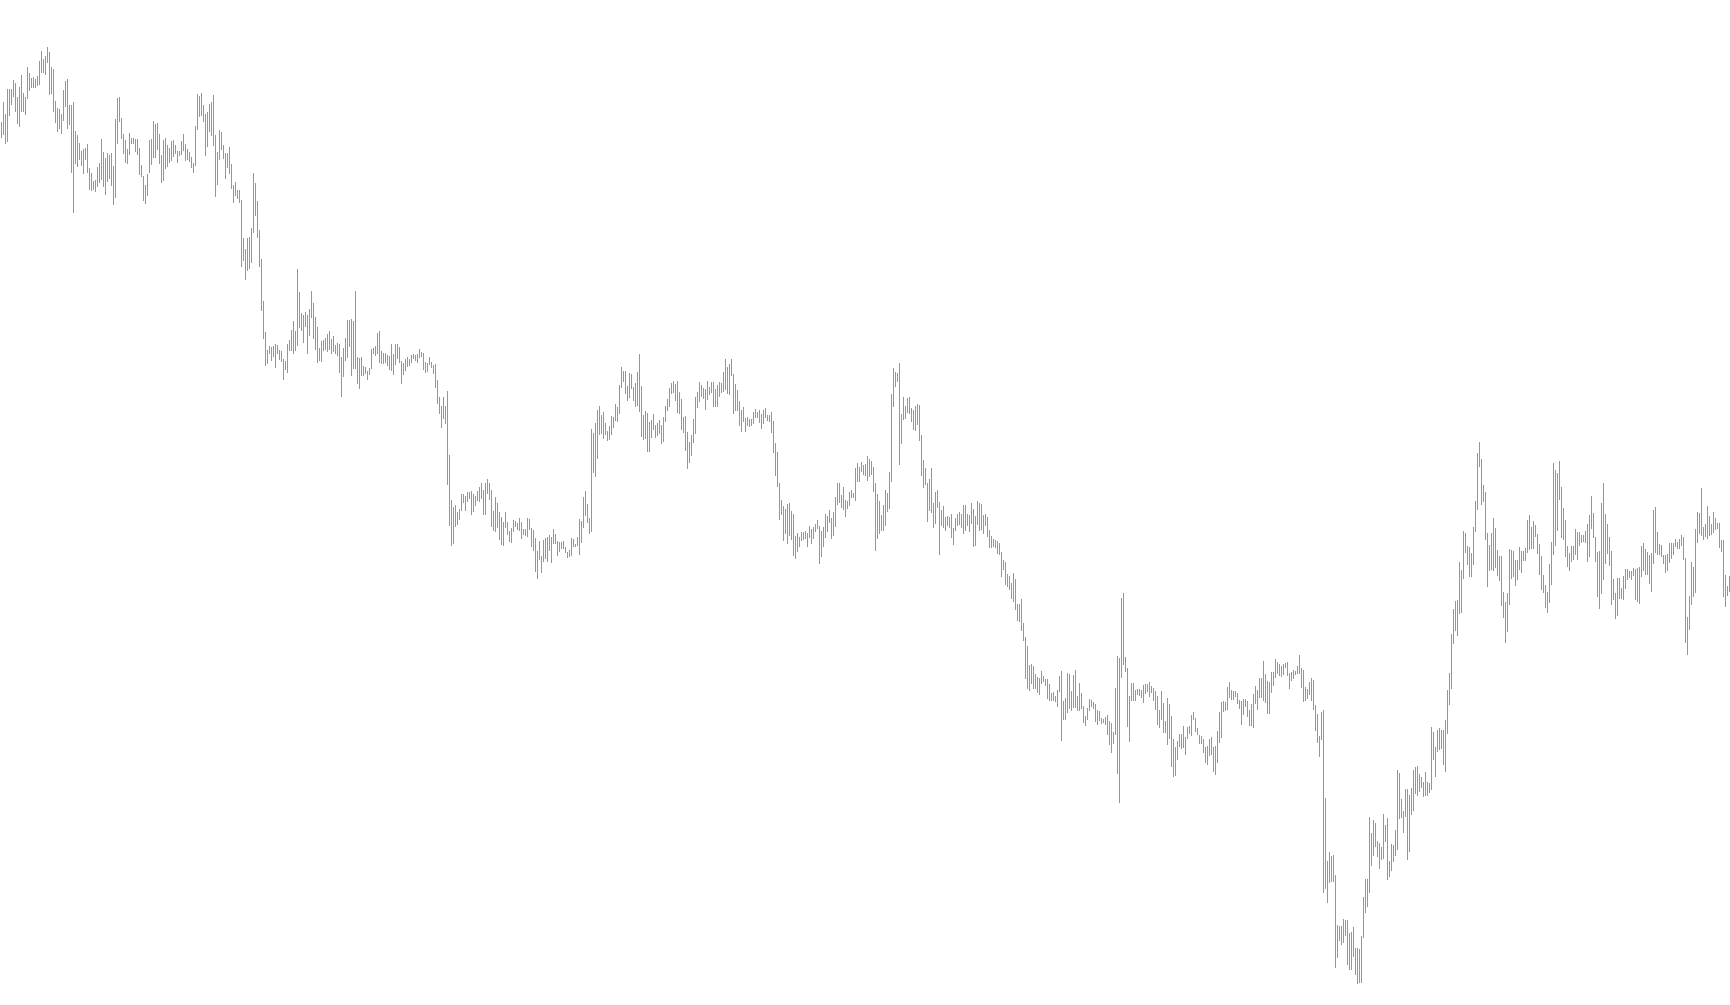
This script is designed to automatically identify and visualize specific price action zones on a trading chart based on the time of day. It follows a concept often used in professional trading to identify "breakout" opportunities by highlighting the highest and lowest prices reached during specific market sessions.
Core Functionality
The tool scans historical data (configurable for up to 40 days) and draws several distinct types of rectangles on your chart. These rectangles act as visual markers to help traders see where price boundaries were set during important periods, such as the London Open or subsequent trading sessions.
How the Logic Works
The script operates by identifying two primary time windows: Period A (the initial opening period) and Period B (a secondary following period). For every day in the look-back period, it performs the following steps:
- Price Identification: It automatically calculates the highest price reached and the lowest price reached within your defined start and end times.
- Visual Mapping: Instead of just showing a single line, it draws multiple specific zones to provide a comprehensive view of market volatility:
- Combined Range: A large rectangle covering the entire duration from the start of Period A to the end of Period B. This shows the overall "box" for the session.
- Specific Session Boxes: Separate boxes are drawn for Period A and Period B individually. These allow you to see how the price range expanded or contracted as the day progressed.
- Breakout Bands: The script draws thin, specialized "bands" at the very top and bottom of the price range. These are designed to help traders spot when the price moves beyond the established highs or lows (the breakout).
Key Features for the User
- Time Flexibility: You can customize the start and end times for both periods. If a session starts late at night and ends on the following calendar day, the script includes logic to handle that "next-day" transition automatically.
- Customizable Visuals: Each type of box can be colored differently and set to either be a solid filled shape or just an outline. This makes it easy to distinguish between different types of price zones at a glance.
- Unique Identification: The script uses a unique ID system, which allows you to run multiple instances of the tool on the same chart without them interfering with each other’s drawings.
- Automatic Cleanup: When the tool is removed from the chart, it automatically cleans up the drawings, leaving your workspace tidy.
- Data Labels: For the primary period boxes, the script automatically prints the exact High and Low price values as text on the chart for quick reference.
In summary, this tool automates the tedious task of manually drawing "high-low" boxes for every trading day, providing a consistent visual history of market boundaries to help identify potential breakout trades.
//+------------------------------------------------------------------+
//|                                               BreakOut_BOX_Hour.mq4 |
//|                                                        hapalkos  |
//|                                                       2007.02.13 |
//|      Code based on TIME1_modified.mq4 shown below                |
//|         posted to Forex Factory by glenn5t                       |
//|      Concept of the break-out box form by Markj                  |
//|                                                                  |
//|   ++ modified so that rectangles do not overlay                  |
//|   ++ this makes color selection more versatile                   |
//|  +++ code consolidated to facilitate changes                     |
//|  +++ changed period B rectangle and added offset value           |
//|  +++ corrected error in high-low code                            |
//| ++++ added ability to cross mid-night(nextDayA, nextDayB)        |
//| ++++ added Unique ID to allow for multiple indicators            |
//| ++++ added ability to delete specific rectangles                 |
//+------------------------------------------------------------------+
#property copyright "hapalkos"
#property link      ""

#property indicator_chart_window
                                 // Opening Range Break-Out per Mark Fisher in "The Logical Trader"
                                 // more suitable to futures than spot forex

extern string UniqueID        = "100302";  // --- Server Time --- GMT+2 ---
extern int    NumberOfDays    = 40;
extern string periodA_begin   = "10:02";     // London Open
extern string periodA_end     = "10:03";     // First thirty minutes after open
extern int    nextDayA        = 0;           // Set to zero if periodA_begin and periodA_end are on the same day.
                                             // Set to one if periodA_end is on the next day.
extern string periodB_end     = "10:50";     // London close
extern int    nextDayB        = 0;           // Set to zero if periodA_begin and periodB_end are on the same day.
                                             // Set to one if periodB_end is on the next day.
extern color  rectAB_color       = DarkGray;
extern bool   rectAB_background  = true;        // true - filled solid; false - outline
extern color  rectA_color        = Gray;
extern bool   rectA_background   = false;       // true - filled solid; false - outline
extern color  rectB1_color       = Gray;
extern bool   rectB1_background  = false;       // true - filled solid; false - outline
extern int    rectB1_band        = 28;    // a-value       // Box Break-Out Band for the Period B rectangle
extern color  rectsB2_color      = Gray;
extern bool   rectsB2_background = false;        // true - filled solid, false - outline
extern int    rectsB2_band       = 56;    // c-value       // Box Break-Our Band for the two upper and lower rectangles

//+------------------------------------------------------------------+
//| Custom indicator initialization function                         |
//+------------------------------------------------------------------+
void init() {
  DeleteObjects();
}

//+------------------------------------------------------------------+
//| Custor indicator deinitialization function                       |
//+------------------------------------------------------------------+
void deinit() {
  DeleteObjects();
return(0);
}

//+------------------------------------------------------------------+
//| Remove all indicator Rectangles                                  |
//+------------------------------------------------------------------+
void DeleteObjects() {
      datetime dtTradeDate=TimeCurrent();

  for (int i=0; i<NumberOfDays; i++) {

    ObjectDelete(UniqueID + " BoxHL  " + TimeToStr(dtTradeDate,TIME_DATE));
    ObjectDelete(UniqueID + " BoxBO_High  " + TimeToStr(dtTradeDate,TIME_DATE));
    ObjectDelete(UniqueID + " BoxBO_Low  " + TimeToStr(dtTradeDate,TIME_DATE));
    ObjectDelete(UniqueID + " BoxPeriodA  " + TimeToStr(dtTradeDate,TIME_DATE));
    ObjectDelete(UniqueID + " BoxPeriodB  " + TimeToStr(dtTradeDate,TIME_DATE));

    dtTradeDate=decrementTradeDate(dtTradeDate);
    while (TimeDayOfWeek(dtTradeDate) > 5 || TimeDayOfWeek(dtTradeDate) < 1 ) dtTradeDate = decrementTradeDate(dtTradeDate);     // Removed Sundays from plots
    }
 return(0);
}

//+------------------------------------------------------------------+
//| Custom indicator iteration function                              |
//+------------------------------------------------------------------+
void start() {
  datetime dtTradeDate=TimeCurrent();

  for (int i=0; i<NumberOfDays; i++) {

    DrawObjects(dtTradeDate, UniqueID + " BoxHL  " + TimeToStr(dtTradeDate,TIME_DATE), periodA_begin, periodA_end, periodB_end, rectAB_color, 0, 1, rectAB_background,nextDayA,nextDayB);
    DrawObjects(dtTradeDate, UniqueID + " BoxBO_High  " + TimeToStr(dtTradeDate,TIME_DATE), periodA_begin, periodA_end, periodB_end, rectsB2_color, rectsB2_band,2,rectsB2_background,nextDayA,nextDayB);
    DrawObjects(dtTradeDate, UniqueID + " BoxBO_Low  " + TimeToStr(dtTradeDate,TIME_DATE), periodA_begin, periodA_end, periodB_end, rectsB2_color, rectsB2_band,3,rectsB2_background,nextDayA,nextDayB);
    DrawObjects(dtTradeDate, UniqueID + " BoxPeriodA  " + TimeToStr(dtTradeDate,TIME_DATE), periodA_begin, periodA_end, periodA_end, rectA_color, 0,4, rectA_background,nextDayA,nextDayB);
    DrawObjects(dtTradeDate, UniqueID + " BoxPeriodB  " + TimeToStr(dtTradeDate,TIME_DATE), periodA_begin, periodA_end, periodB_end, rectB1_color, rectB1_band,5, rectB1_background,nextDayA,nextDayB);

    dtTradeDate=decrementTradeDate(dtTradeDate);
    while (TimeDayOfWeek(dtTradeDate) > 5 || TimeDayOfWeek(dtTradeDate) < 1 ) dtTradeDate = decrementTradeDate(dtTradeDate);     // Removed Sundays from plots
  }
}

//+------------------------------------------------------------------+
//| Create Rectangles                                                |
//+------------------------------------------------------------------+

void DrawObjects(datetime dtTradeDate, string sObjName, string sTimeBegin, string sTimeEnd, string sTimeObjEnd, color cObjColor, int iOffSet, int iForm, bool background, int nextDayA, int nextDayB) {
  datetime dtTimeBegin, dtTimeEnd, dtTimeObjEnd;
  double   dPriceHigh,  dPriceLow;
  int      iBarBegin,   iBarEnd;

  dtTimeBegin = StrToTime(TimeToStr(dtTradeDate, TIME_DATE) + " " + sTimeBegin);
  dtTimeEnd = StrToTime(TimeToStr(dtTradeDate, TIME_DATE) + " " + sTimeEnd);
  dtTimeObjEnd = StrToTime(TimeToStr(dtTradeDate, TIME_DATE) + " " + sTimeObjEnd);

  if(nextDayA == 1) dtTimeEnd = dtTimeEnd + 86400;
  if(nextDayB == 1) dtTimeObjEnd = dtTimeObjEnd + 86400;
  if(nextDayA == 1 && TimeDayOfWeek(dtTradeDate) == 5) dtTimeEnd = dtTimeEnd + (2 * 86400);
  if(nextDayB == 1 && TimeDayOfWeek(dtTradeDate) == 5) dtTimeObjEnd = dtTimeObjEnd + (2 * 86400);

  iBarBegin = iBarShift(NULL, 0, dtTimeBegin)+1;                                    // added 1 to bar count to correct calculation for highest price for the period
  iBarEnd = iBarShift(NULL, 0, dtTimeEnd)+1;                                        // added 1 to bar count to correct calculation for lowest price for the period
  dPriceHigh = High[Highest(NULL, 0, MODE_HIGH, (iBarBegin)-iBarEnd, iBarEnd)];
  dPriceLow = Low [Lowest (NULL, 0, MODE_LOW , (iBarBegin)-iBarEnd, iBarEnd)];

  ObjectCreate(sObjName, OBJ_RECTANGLE, 0, 0, 0, 0, 0);

//---- High-Low Rectangle - Period A and B combined
   if(iForm==1){
      ObjectSet(sObjName, OBJPROP_TIME1 , dtTimeBegin);
      ObjectSet(sObjName, OBJPROP_TIME2 , dtTimeObjEnd);
      ObjectSet(sObjName, OBJPROP_PRICE1, dPriceHigh);
      ObjectSet(sObjName, OBJPROP_PRICE2, dPriceLow);
      ObjectSet(sObjName, OBJPROP_STYLE, STYLE_SOLID);
      ObjectSet(sObjName, OBJPROP_COLOR, cObjColor);
      ObjectSet(sObjName, OBJPROP_BACK, background);
   }

//---- Upper Rectangle  - Period B
  if(iForm==2){
      ObjectSet(sObjName, OBJPROP_TIME1 , dtTimeEnd);
      ObjectSet(sObjName, OBJPROP_TIME2 , dtTimeObjEnd);
      ObjectSet(sObjName, OBJPROP_PRICE1, dPriceHigh);
      ObjectSet(sObjName, OBJPROP_PRICE2, dPriceHigh + iOffSet*Point);
      ObjectSet(sObjName, OBJPROP_STYLE, STYLE_SOLID);
      ObjectSet(sObjName, OBJPROP_COLOR, cObjColor);
      ObjectSet(sObjName, OBJPROP_BACK, background);
   }

 //---- Lower Rectangle - Period B
  if(iForm==3){
      ObjectSet(sObjName, OBJPROP_TIME1 , dtTimeEnd);
      ObjectSet(sObjName, OBJPROP_TIME2 , dtTimeObjEnd);
      ObjectSet(sObjName, OBJPROP_PRICE1, dPriceLow - iOffSet*Point);
      ObjectSet(sObjName, OBJPROP_PRICE2, dPriceLow);
      ObjectSet(sObjName, OBJPROP_STYLE, STYLE_SOLID);
      ObjectSet(sObjName, OBJPROP_COLOR, cObjColor);
      ObjectSet(sObjName, OBJPROP_BACK, background);
   }

//---- Period A Rectangle
  if(iForm==4){
      ObjectSet(sObjName, OBJPROP_TIME1 , dtTimeBegin);
      ObjectSet(sObjName, OBJPROP_TIME2 , dtTimeEnd);
      ObjectSet(sObjName, OBJPROP_PRICE1, dPriceHigh);
      ObjectSet(sObjName, OBJPROP_PRICE2, dPriceLow);
      ObjectSet(sObjName, OBJPROP_STYLE, STYLE_SOLID);
      ObjectSet(sObjName, OBJPROP_COLOR, cObjColor);
      ObjectSet(sObjName, OBJPROP_WIDTH, 2);
      ObjectSet(sObjName, OBJPROP_BACK, background);
      string sObjDesc = StringConcatenate("High: ",dPriceHigh,"  Low: ", dPriceLow);
      ObjectSetText(sObjName, sObjDesc,10,"Times New Roman",Black);
   }
//---- Period B Rectangle
  if(iForm==5){
      ObjectSet(sObjName, OBJPROP_TIME1 , dtTimeEnd);
      ObjectSet(sObjName, OBJPROP_TIME2 , dtTimeObjEnd);
      ObjectSet(sObjName, OBJPROP_PRICE1, dPriceHigh + iOffSet*Point);
      ObjectSet(sObjName, OBJPROP_PRICE2, dPriceLow - iOffSet*Point);
      ObjectSet(sObjName, OBJPROP_STYLE, STYLE_SOLID);
      ObjectSet(sObjName, OBJPROP_COLOR, cObjColor);
      ObjectSet(sObjName, OBJPROP_WIDTH, 2);
      ObjectSet(sObjName, OBJPROP_BACK, background);
   }
}

//+------------------------------------------------------------------+
//| Decrement Date to draw objects in the past                       |
//+------------------------------------------------------------------+

datetime decrementTradeDate (datetime dtTimeDate) {
   int iTimeYear=TimeYear(dtTimeDate);
   int iTimeMonth=TimeMonth(dtTimeDate);
   int iTimeDay=TimeDay(dtTimeDate);
   int iTimeHour=TimeHour(dtTimeDate);
   int iTimeMinute=TimeMinute(dtTimeDate);

   iTimeDay--;
   if (iTimeDay==0) {
     iTimeMonth--;
     if (iTimeMonth==0) {
       iTimeYear--;
       iTimeMonth=12;
     }

     // Thirty days hath September...
     if (iTimeMonth==4 || iTimeMonth==6 || iTimeMonth==9 || iTimeMonth==11) iTimeDay=30;
     // ...all the rest have thirty-one...
     if (iTimeMonth==1 || iTimeMonth==3 || iTimeMonth==5 || iTimeMonth==7 || iTimeMonth==8 || iTimeMonth==10 || iTimeMonth==12) iTimeDay=31;
     // ...except...
     if (iTimeMonth==2) if (MathMod(iTimeYear, 4)==0) iTimeDay=29; else iTimeDay=28;
   }
  return(StrToTime(iTimeYear + "." + iTimeMonth + "." + iTimeDay + " " + iTimeHour + ":" + iTimeMinute));
}

//+------------------------------------------------------------------+
//
//
//

/*
//+------------------------------------------------------------------+
//|                                                        times.mq4 |
//|                                                                  |
//|               Made/Modified by sh _j .                           |
//+------------------------------------------------------------------+
#property copyright "Morning Star"
#property link      "http://Grand Forex.ir"

#property indicator_chart_window


extern int    NumberOfDays = 50;
extern string AsiaBegin    = "01:00";
extern string AsiaEnd      = "09:00";
extern color  AsiaColor    = Red;
extern string EurBegin     = "09:00";
extern string EurEnd       = "16:00";
extern color  EurColor     = Blue;
extern string USABegin     = "16:00";
extern string USAEnd       = "23:00";
extern color  USAColor     = Tan;


//+------------------------------------------------------------------+
//| Custom indicator initialization function                         |
//+------------------------------------------------------------------+
void init() {
  DeleteObjects();
  for (int i=0; i<NumberOfDays; i++) {
    CreateObjects("AS"+i, AsiaColor);
    CreateObjects("EU"+i, EurColor);
    CreateObjects("US"+i, USAColor);
  }
  Comment("");
}

//+------------------------------------------------------------------+
//| Custor indicator deinitialization function                       |
//+------------------------------------------------------------------+
void deinit() {
  DeleteObjects();
  Comment("");
}


void CreateObjects(string no, color cl) {
  ObjectCreate(no, OBJ_RECTANGLE, 0, 0,0, 0,0);
  ObjectSet(no, OBJPROP_STYLE, STYLE_SOLID);
  ObjectSet(no, OBJPROP_COLOR, cl);
  ObjectSet(no, OBJPROP_BACK, True);
}

//+------------------------------------------------------------------+
//| Óäàëåíèå îáúåêòîâ èíäèêàòîðà                                     |
//+------------------------------------------------------------------+
void DeleteObjects() {
  for (int i=0; i<NumberOfDays; i++) {
    ObjectDelete("AS"+i);
    ObjectDelete("EU"+i);
    ObjectDelete("US"+i);
  }
}

//+------------------------------------------------------------------+
//| Custom indicator iteration function                              |
//+------------------------------------------------------------------+
void start() {
  datetime dt=CurTime();

  for (int i=0; i<NumberOfDays; i++) {
    DrawObjects(dt, "AS"+i, AsiaBegin, AsiaEnd);
    DrawObjects(dt, "EU"+i, EurBegin, EurEnd);
    DrawObjects(dt, "US"+i, USABegin, USAEnd);
    dt=decDateTradeDay(dt);
    while (TimeDayOfWeek(dt)>5) dt=decDateTradeDay(dt);
  }
}


void DrawObjects(datetime dt, string no, string tb, string te) {
  datetime t1, t2;
  double   p1, p2;
  int      b1, b2;

  t1=StrToTime(TimeToStr(dt, TIME_DATE)+" "+tb);
  t2=StrToTime(TimeToStr(dt, TIME_DATE)+" "+te);
  b1=iBarShift(NULL, 0, t1);
  b2=iBarShift(NULL, 0, t2);
  p1=High[Highest(NULL, 0, MODE_HIGH, b1-b2, b2)];
  p2=Low [Lowest (NULL, 0, MODE_LOW , b1-b2, b2)];
  ObjectSet(no, OBJPROP_TIME1 , t1);
  ObjectSet(no, OBJPROP_PRICE1, p1);
  ObjectSet(no, OBJPROP_TIME2 , t2);
  ObjectSet(no, OBJPROP_PRICE2, p2);
}


datetime decDateTradeDay (datetime dt) {
  int ty=TimeYear(dt);
  int tm=TimeMonth(dt);
  int td=TimeDay(dt);
  int th=TimeHour(dt);
  int ti=TimeMinute(dt);

  td--;
  if (td==0) {
    tm--;
    if (tm==0) {
      ty--;
      tm=12;
    }
    if (tm==1 || tm==3 || tm==5 || tm==7 || tm==8 || tm==10 || tm==12) td=31;
    if (tm==2) if (MathMod(ty, 4)==0) td=29; else td=28;
    if (tm==4 || tm==6 || tm==9 || tm==11) td=30;
  }
  return(StrToTime(ty+"."+tm+"."+td+" "+th+":"+ti));
}
//+------------------------------------------------------------------+
*/
Comments