BPA-D1LondonSession
Download script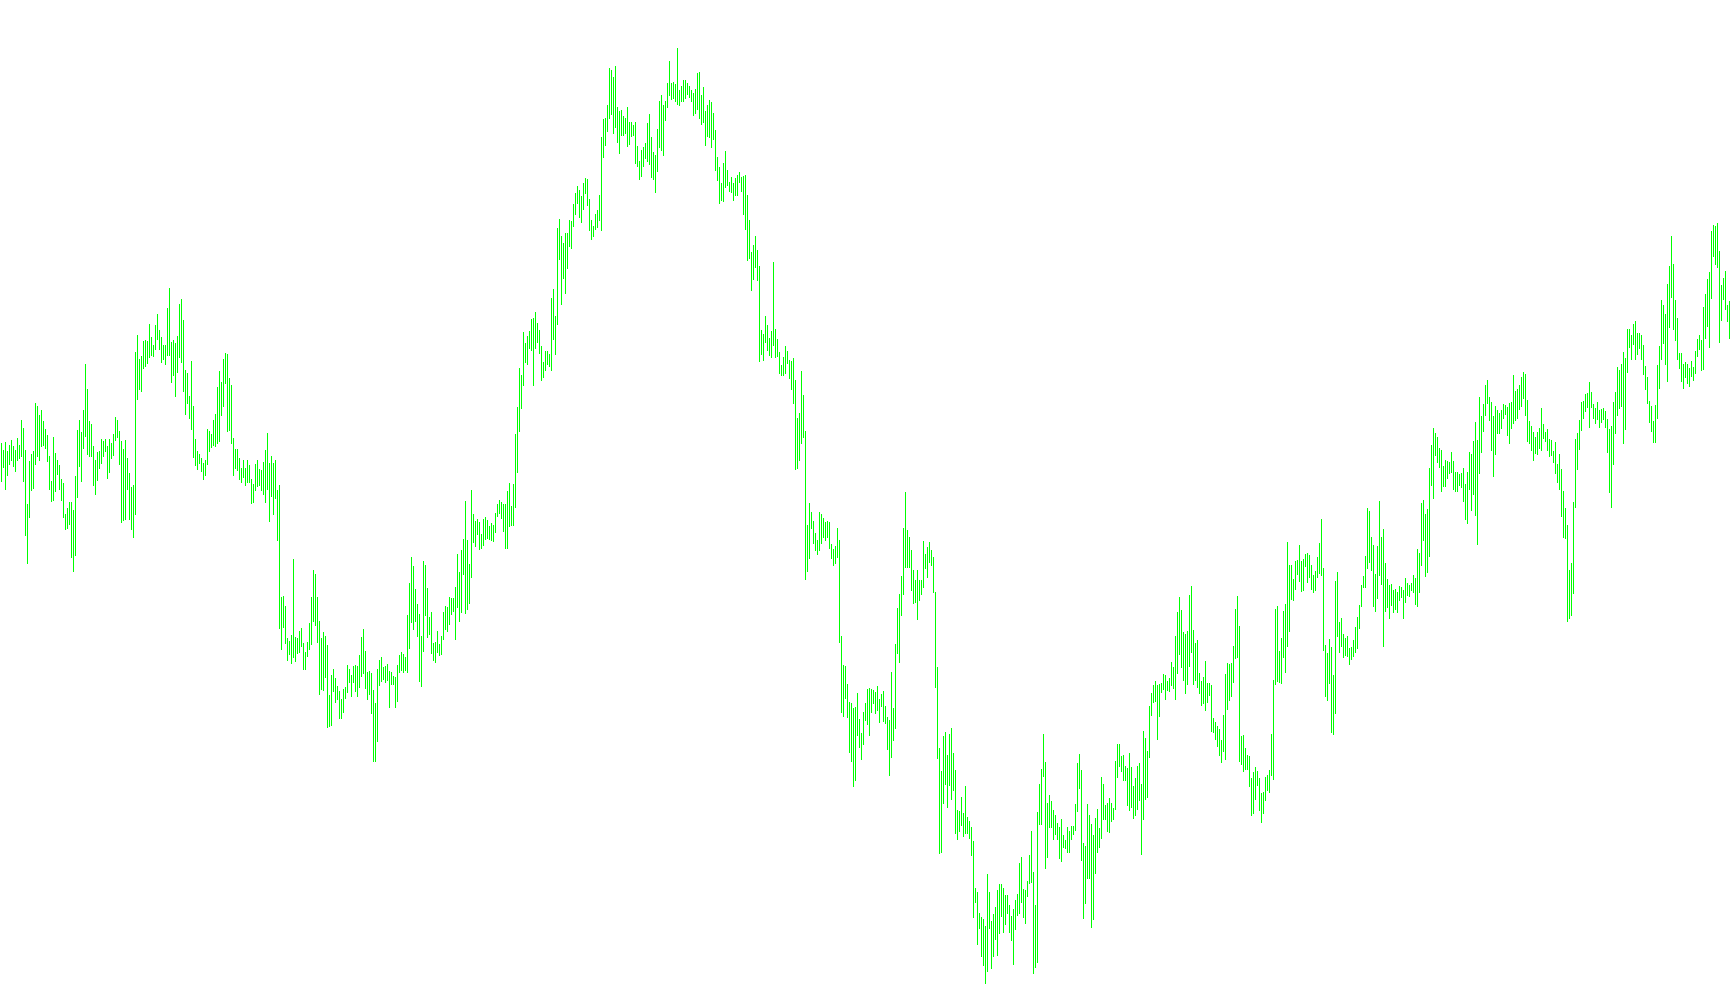
This tool is designed to provide a clear visual representation of the London trading session's price action directly on your trading chart. Rather than showing every minute-by-minute fluctuation, it distills specific timeframes into distinct "candles" to help traders identify the core price movements during the high-activity London hours.
Core Functionality
The script works by pinpointing a specific window of time—defined by a user-set start and end time—and analyzing the price data within that period. It then converts that data into a visual candle structure (a body and a shadow) on your chart. This allows for a cleaner, more organized view of how the market moved during the session.
How the Logic Works
- Timezone and Session Mapping: The script looks at the daily timeframe to establish the date and then dives down into a smaller timeframe (5-minute intervals). It calculates exactly where the London session opens and closes based on the hours you provide in the settings.
- Price Identification: Once the start and end times are identified, the script scans the price movement between those two points to find three key pieces of information:
- The Open and Close: The exact price at the beginning and the end of your specified session.
- The High and Low: The highest and lowest prices reached at any point during that specific duration.
- Visual Construction: After gathering these four price points, the script draws objects on your chart:
- The Candle Body: It draws a thick line representing the distance between the opening and closing prices. If the session ended higher than it started (a bullish move), it highlights this with a specific color; otherwise, it remains in a neutral state.
- The Shadow: It draws a thin vertical line representing the "wick" or shadow. This shows the total range of the price movement—from the highest peak to the lowest dip—that occurred during the session.
Key Features for the User
- Customizable Session Windows: You can manually input your desired London start and end times.
- Historical Mapping: The tool is capable of looking back over a significant number of past days, automatically plotting these session candles so you can analyze historical price behavior at a glance.
- Daylight Savings Adjustment: It includes a built-in logic toggle to easily account for time shifts during Daylight Savings Time, ensuring the data remains accurate throughout the year.
- Visual Clarity: By placing these "session candles" in the background of your chart, it removes visual clutter, allowing you to see the "big picture" of London's price action without being distracted by minor noise.
Price Data Components
5
Views
0
Downloads
0
Favorites
BPA-D1LondonSession
//+------------------------------------------------------------------+
//| BPA - D1 London Session.mq4.mq4
//| © Ricky.Ricx @ BrooksPriceAction.com
//| http://www.brookspriceaction.com/
//+------------------------------------------------------------------+
#property copyright "© Ricky.Ricx @ BrooksPriceAction.com"
#property link      "http://www.brookspriceaction.com"

#property indicator_chart_window

extern string  London_Open="03:00";
extern string  London_Close="11:55"; //since this use M5 data to find OHLC D1 candle so london close is 11:55 is the same as 12:00
extern int     Show_How_Many_Bars=108;
extern string  To_Change_DST_Bars_Insert_Below="OR If All bars are in DST just change London Open & Close";
extern string  Please_NOTE="If no change insert -1 to both";
extern int     From_Bar=-1,
               To_Bar=-1;

int init()
  {

   int   n,
         addonehour;
      for(n=Show_How_Many_Bars; n!=0; n--)
      {
         if(From_Bar>-1)
         {
            if(From_Bar>=n && n<=To_Bar) addonehour=3600;
         }
            else addonehour=0;
         candle(n,addonehour);
      }
   return(0);
  }

int deinit()
  {
   int      totalobjects;
   totalobjects=ObjectsTotal();

   ObjectsDeleteAll();
   return(0);
  }

int start()
  {
   int      counted_bars=IndicatorCounted(),
            addonehour=0;

   if(To_Bar>-1)
   {
      addonehour=3600;
   }
   candle(0, addonehour);
   return(0);
  }

void candle(int n, int addonehour)
  {
   int      openbar=0,
            closebar=0,
            highestbar=0,
            lowestbar=0;
   double   openprice=0,
            openhigh=0,
            openlow=0,
            closeprice=0,
            closelow=0,
            closehigh=0,
            highestprice=0,
            lowestprice=0;
   datetime candledate,
            opentime,
            closetime,
            hightime,
            lowtime;
   string   candledatestr,
            opentimestr,
            closetimestr,
            hightimestr,
            lowtimestr;

   //find this bar date
   candledate=iTime(Symbol(), PERIOD_D1, n);
   candledatestr=TimeToStr(candledate, TIME_DATE);

   //find this bar open date & time
      opentimestr=candledatestr+" "+London_Open;
      opentime=StrToTime(opentimestr)+addonehour;
   //find open bar number at lower timeframe
      openbar=iBarShift(Symbol(), 5, opentime, false);
   openprice=iOpen(Symbol(), 5, openbar);

   //find this bar close date & time
      closetimestr=candledatestr+" "+London_Close;
      closetime=StrToTime(closetimestr)+addonehour;
   //find close bar number at lower timeframe
      closebar=iBarShift(Symbol(), 5, closetime, false);
   closeprice=iClose(Symbol(), 5, closebar);

   //find highest and lowest bar number
      highestbar=iHighest(Symbol(), 5, MODE_HIGH, Show_How_Many_Bars, closebar);
      lowestbar=iLowest(Symbol(), 5, MODE_LOW, Show_How_Many_Bars, closebar);

   //find highest and lowest price
      highestprice=iHigh(Symbol(), 5, highestbar);
      openhigh=iHigh(Symbol(), 5, openbar);
      closehigh=iHigh(Symbol(), 5, closebar);
   if(openhigh>=highestprice) highestprice=openhigh;
   if(closehigh>=highestprice) highestprice=closehigh;
      lowestprice=iLow(Symbol(), 5, lowestbar);
      openlow=iLow(Symbol(), 5, openbar);
      closelow=iLow(Symbol(), 5, closebar);
   if(openlow<=lowestprice) lowestprice=openlow;
   if(closelow<=lowestprice) lowestprice=closelow;

   //plot candle body
   if(ObjectFind(candledatestr+" candlebody")==-1) ObjectCreate(candledatestr+" candlebody", OBJ_TREND, 0, 0, 0);
   ObjectSet(candledatestr+" candlebody", OBJPROP_PRICE1, openprice);
   ObjectSet(candledatestr+" candlebody", OBJPROP_PRICE2, closeprice);
   ObjectSet(candledatestr+" candlebody", OBJPROP_TIME1, candledate);
   ObjectSet(candledatestr+" candlebody", OBJPROP_TIME2, candledate);
   ObjectSet(candledatestr+" candlebody", OBJPROP_RAY, false);
   ObjectSet(candledatestr+" candlebody", OBJPROP_BACK, true);
   ObjectSet(candledatestr+" candlebody", OBJPROP_WIDTH, 5);
   ObjectSet(candledatestr+" candlebody", OBJPROP_COLOR, Black);

   //plot bull candle body
   if(openprice<closeprice)
   {
      if(ObjectFind(candledatestr+" bull candlebody")==-1) ObjectCreate(candledatestr+" bull candlebody", OBJ_TREND, 0, 0, 0);
      ObjectSet(candledatestr+" bull candlebody", OBJPROP_PRICE1, openprice);
      ObjectSet(candledatestr+" bull candlebody", OBJPROP_PRICE2, closeprice);
      ObjectSet(candledatestr+" bull candlebody", OBJPROP_TIME1, candledate);
      ObjectSet(candledatestr+" bull candlebody", OBJPROP_TIME2, candledate);
      ObjectSet(candledatestr+" bull candlebody", OBJPROP_RAY, false);
      ObjectSet(candledatestr+" bull candlebody", OBJPROP_WIDTH, 3);
      ObjectSet(candledatestr+" bull candlebody", OBJPROP_COLOR, White);
   }

   //plot candle shadows
   if(ObjectFind(candledatestr+" candleshadow")==-1) ObjectCreate(candledatestr+" candleshadow", OBJ_TREND, 0, 0, 0);
   ObjectSet(candledatestr+" candleshadow", OBJPROP_PRICE1, highestprice);
   ObjectSet(candledatestr+" candleshadow", OBJPROP_PRICE2, lowestprice);
   ObjectSet(candledatestr+" candleshadow", OBJPROP_TIME1, candledate);
   ObjectSet(candledatestr+" candleshadow", OBJPROP_TIME2, candledate);
   ObjectSet(candledatestr+" candleshadow", OBJPROP_RAY, false);
   ObjectSet(candledatestr+" candleshadow", OBJPROP_BACK, true);
   ObjectSet(candledatestr+" candleshadow", OBJPROP_WIDTH, 1);
   ObjectSet(candledatestr+" candleshadow", OBJPROP_COLOR, Black);

   return(0);
  }
Comments