BTtrend Trigger_v1
Download script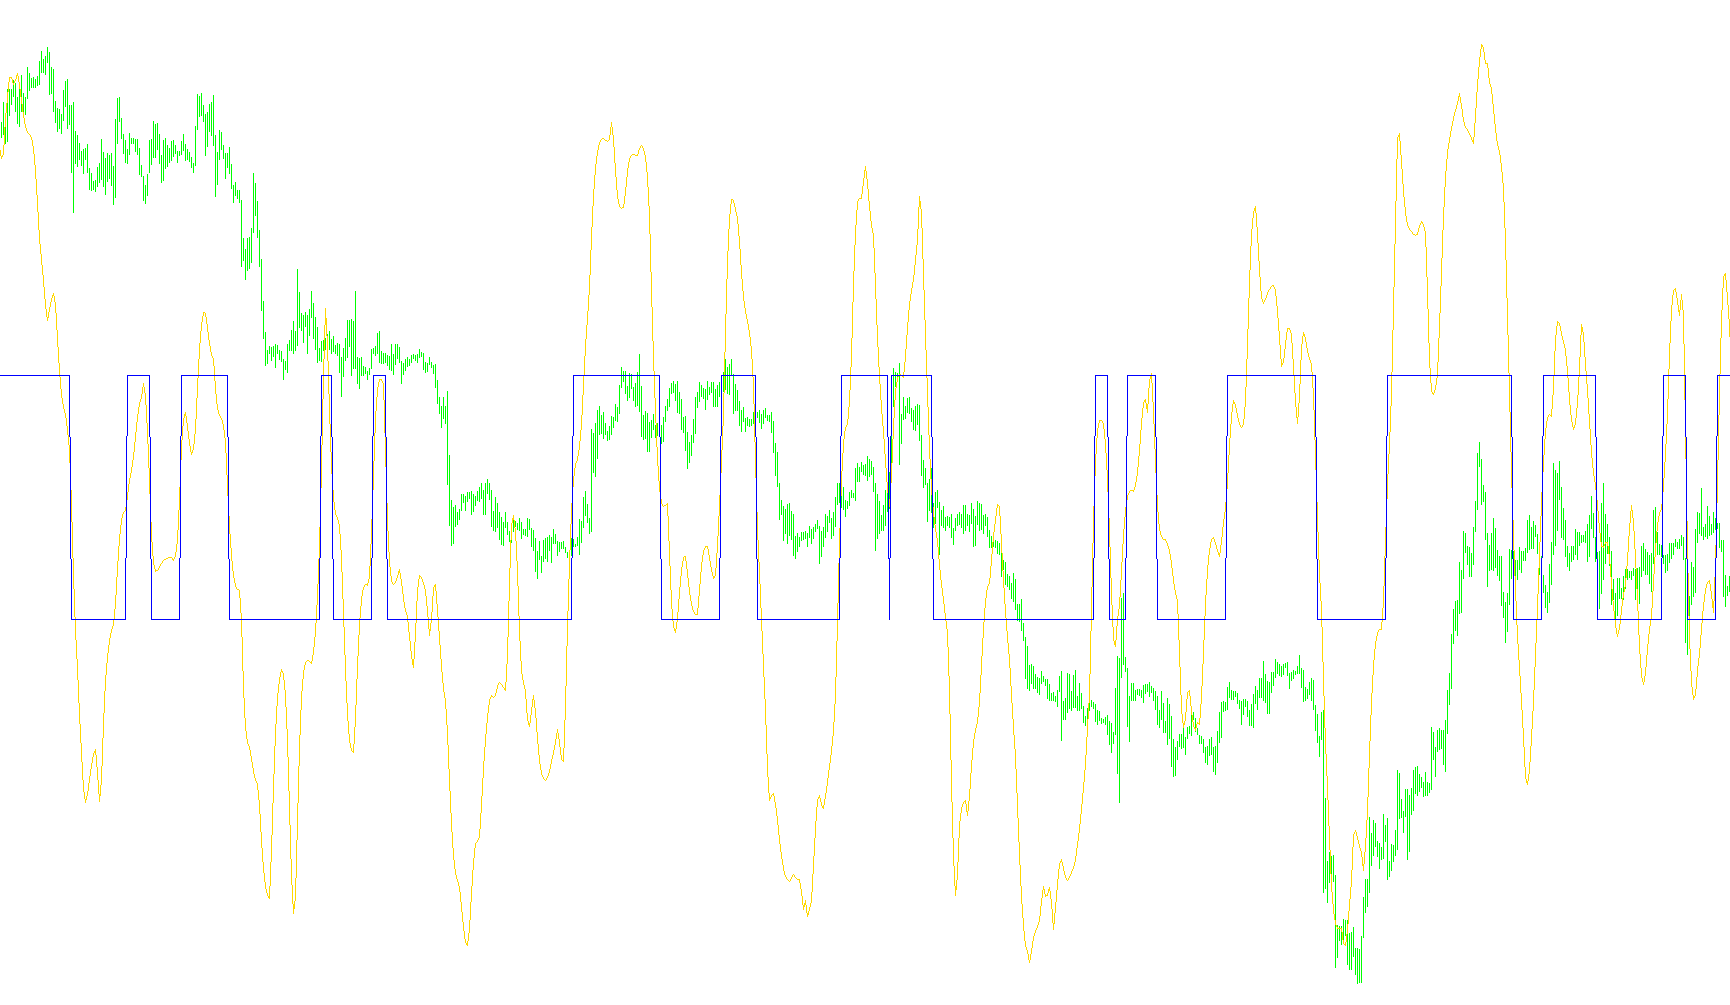
This script functions as a custom technical indicator designed to visualize market momentum and sentiment by comparing recent price action against historical extremes. It operates in a separate window, providing a clearer view of the "buying" and "selling" pressures without cluttering the main price chart.
Core Logic and Methodology
The indicator identifies trends by analyzing the relationship between two distinct timeframes of price data: a "Recent" period and an "Older" period.
1. Power Calculation The logic first determines the "Power" of both buyers and sellers:
- Buy Power: Calculated by looking at the highest high reached in the most recent timeframe and comparing it to the lowest low of a previous, older timeframe.
- Sell Power: Calculated by looking at the highest high of the older timeframe compared to the lowest low of the recent timeframe.
2. The TTF Metric Once these two values are established, the script calculates a percentage-based ratio known as TTF. This value represents the relative strength of buying pressure versus selling pressure. By normalizing these figures into a percentage, the indicator creates a balanced view of which side of the market is currently dominating.
3. Smoothing and Filtering To prevent the data from being too erratic or "noisy," the script applies several layers of mathematical smoothing:
- Exponential Weighting: The raw TTF value passes through a multi-stage smoothing process (represented by variables e1 through e6). This helps eliminate minor fluctuations while retaining the overall trend.
- Polynomial Adjustment: A final calculation is applied to the smoothed data to refine the curve, ensuring that the resulting line accurately reflects sustained market movements rather than temporary spikes.
Visual Representation
The indicator provides two distinct visual components:
- The Main Line (Light Sea Green): This represents the processed TTF value. It moves dynamically across the window as new price data arrives, showing the smoothed momentum of the market.
- The Signal Line (Red): This acts as a binary threshold indicator. It monitors the Main Line's position:
- If the Main Line is above zero (positive sentiment), the Signal Line moves to the top of the window.
- If the Main Line drops below zero (negative sentiment), the Signal Line moves to the bottom of the window.
In summary, this tool is designed to help users identify whether the current market "energy" is leaning toward bullish or bearish territory by comparing recent price volatility against historical highs and lows, then filtering that data into a smooth, readable trend line.
/*-----------------------------+
|			       |
| Shared by www.Aptrafx.com    |
|			       |
+------------------------------*/

#property indicator_separate_window
#property indicator_buffers 2
#property indicator_color1 LightSeaGreen
#property indicator_color2 Red
//---- input parameters
extern int TTFbars=15;
//15=default number of bars for computation
extern int TopLine=50;
extern int BottomLine=-50;
extern int t3_period=5;
extern double b=0.7;
//---- buffers
double MainBuffer[];
double SignalBuffer[];
//----
int draw_begin1=0;
int draw_begin2=0;
double b2=0;
double b3=0;
double c1=0;
double c2=0;
double c3=0;
double c4=0;
double r=0;
double w1=0;
double w2=0;
double e1 = 0;
double e2 = 0;
double e3 = 0;
double e4 = 0;
double e5 = 0;
double e6 = 0;
double  HighestHighRecent=0;
double  HighestHighOlder =0;
double  LowestLowRecent =0;
double  LowestLowOlder =0;
double  BuyPower =0;
double  SellPower=0;
double  TTF=0;

//+------------------------------------------------------------------+
//| Custom indicator initialization function                         |
//+------------------------------------------------------------------+
int init()
  {
   string short_name;
//---- 2 additional buffers are used for counting.
   IndicatorBuffers(2);
//---- indicator lines
   SetIndexStyle(0,DRAW_LINE);
   SetIndexBuffer(0, MainBuffer);
   SetIndexStyle(1,DRAW_LINE);
   SetIndexBuffer(1, SignalBuffer);
//---- name for DataWindow and indicator subwindow label
   short_name="TTF("+TTFbars;
   IndicatorShortName(short_name);
   SetIndexLabel(0,short_name);
   SetIndexLabel(1,"Signal");
//----
   draw_begin1=TTFbars*2+1;
   draw_begin2=draw_begin1;
   SetIndexDrawBegin(0,draw_begin1);
   SetIndexDrawBegin(1,draw_begin2);

   b2=b*b;
   b3=b2*b;
   c1=-b3;
   c2=(3*(b2+b3));
   c3=-3*(2*b2+b+b3);
   c4=(1+3*b+b3+3*b2);

   r=t3_period;

   if (r<1) r=1;
   r = 1 + 0.5*(r-1);
   w1 = 2 / (r + 1);
   w2 = 1 - w1;

//----
   return(0);
  }
//+------------------------------------------------------------------+
//| ttf                                            |
//+------------------------------------------------------------------+
int start()
  {
   int    i,k;
   int    counted_bars=IndicatorCounted();
   double price;
//----
   if(Bars<=draw_begin2) return(0);
//---- initial zero
   if(counted_bars<1)
     {
      for(i=1;i<=draw_begin1;i++) MainBuffer[Bars-i]=0;
      for(i=1;i<=draw_begin2;i++) SignalBuffer[Bars-i]=0;
     }
//---- %K line
   i=Bars-draw_begin1;
   if(counted_bars>draw_begin1) i=Bars-counted_bars-1;
   while(i>=0)
     {
  HighestHighRecent=High[Highest(NULL,0,MODE_HIGH,TTFbars,i)];//High[Highest(MODE_HIGH,shift+TTFbars-1,TTFbars)];
  HighestHighOlder =High[Highest(NULL,0,MODE_HIGH,TTFbars,i+TTFbars)];//High[Highest(MODE_HIGH,shift+TTFbars*2-1,TTFbars)];
  LowestLowRecent =Low[Lowest(NULL,0,MODE_LOW,TTFbars,i)];//Low [Lowest (MODE_LOW ,shift+TTFbars-1,TTFbars)];
  LowestLowOlder =Low[Lowest(NULL,0,MODE_LOW,TTFbars,i+TTFbars)];//Low [Lowest (MODE_LOW ,shift+TTFbars*2-1,TTFbars)];
  BuyPower =HighestHighRecent-LowestLowOlder;
  SellPower=HighestHighOlder -LowestLowRecent;
  TTF=(BuyPower-SellPower)/(0.5*(BuyPower+SellPower))*100;

  e1 = w1*TTF + w2*e1;
  e2 = w1*e1 + w2*e2;
  e3 = w1*e2 + w2*e3;
  e4 = w1*e3 + w2*e4;
  e5 = w1*e4 + w2*e5;
  e6 = w1*e5 + w2*e6;

  TTF = c1*e6 + c2*e5 + c3*e4 + c4*e3;

  MainBuffer[i]=TTF;
  i--;
 }
//---- last counted bar will be recounted
   if(counted_bars>0) counted_bars--;
   int limit=Bars-counted_bars;
//---- signal line is simple movimg average
   for(i=0; i<limit; i++) {
      if (MainBuffer[i]>=0)
         SignalBuffer[i]=TopLine;
      else
         SignalBuffer[i]=BottomLine;
   }
//----
   return(0);
  }
//+------------------------------------------------------------------+
Comments