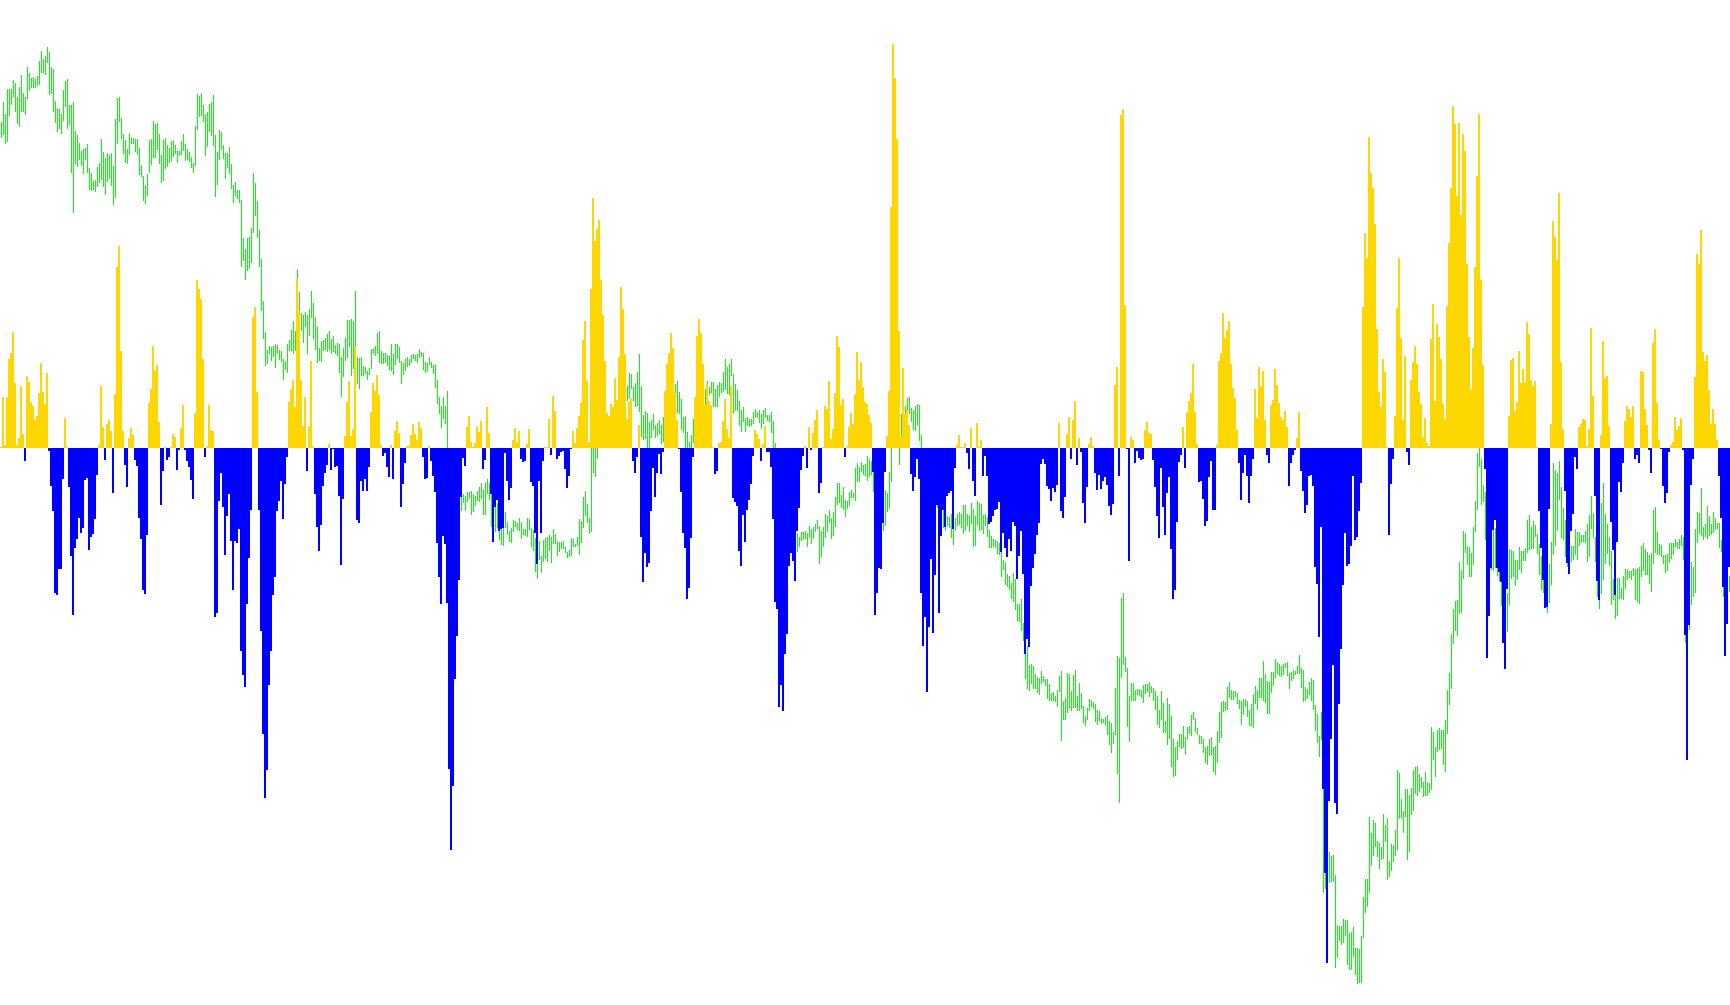
This tool is designed to help traders visualize market momentum and identify potential buying or selling opportunities by analyzing the relationship between current price action and moving averages. Instead of just looking at raw price movement, it calculates a specific "power" value to determine whether the market leans toward a bullish (upward) or bearish (downward) trend.
How the Logic Works
1. The Core Calculation The script continuously monitors two main components of the market: the highest and lowest prices reached during a specific timeframe, and the Moving Average (the "average" price over a set period). By subtracting the average price from both the high and low points, the tool generates a numerical value that represents the current strength or momentum of the market.
2. Visual Representation The results are displayed in a separate window as a histogram:
- Bullish Momentum: When the calculated value is positive (above your set buy level), the histogram shows green bars. This suggests that the price is currently pushing upward with strength.
- Bearish Momentum: When the calculated value falls below your set sell level, the histogram shows red bars. This indicates that downward pressure is dominating the market.
3. Automated Alerts To ensure you don't have to watch the charts constantly, the script includes an intelligent notification system. It monitors for "crosses"—moments when the momentum flips from one direction to another:
- Buy Signals: When the value moves from a negative state to a positive state, the tool can trigger a visual alert on your screen, play a sound file, or send an email notification (if enabled).
- Sell Signals: Conversely, when the value drops from a positive state into a negative one, it triggers a corresponding sell alert.
Summary for the User
Essentially, this tool filters out market "noise" to show you where the real pressure is coming from. It acts as a momentum tracker that tells you: "The price is currently stronger than its average (Green)" or "The price is currently weaker than its average (Red)," providing you with real-time audio and visual cues to help time your entries and exits.
//+------------------------------------------------------------------+
//|                                                        Bears.mq4 |
//|                      Copyright © 2005, MetaQuotes Software Corp. |
//|                                       http://www.metaquotes.net/ |
//+------------------------------------------------------------------+
#property copyright "Copyright © 2005, MetaQuotes Software Corp."
#property link      "http://www.metaquotes.net/"

#property indicator_separate_window
#property indicator_buffers 2
#property indicator_color1 LimeGreen
#property indicator_color2 Red
#property indicator_level1 0
#property indicator_levelcolor Magenta
//#property indicator_color3 Blue

//---- input parameters
extern int       BBPeriod       = 13;
extern int       mamode         = 3;
extern int       price          = PRICE_CLOSE;
extern double    buylevel       = 0.00;
extern double    selllevel      = 0.00;
extern int       histowidth     = 4;
extern string    note13         = "turn on soundAlert = true; turn off = false";
extern bool      SoundON        = true;

extern string    note15         = "send Email Alert = true; turn off = false";
extern bool      EmailON        = false;

extern string    note17         = "turn on Alert = true; turn off = false";
extern bool      AlertON        = true;
extern string    SoundFileName  = "alert.wav";


//---- buffers
double BBUP[], BBDOWN[], avg[];
int    flagval1 = 0;
int    flagval2 = 0;
double val;
//+------------------------------------------------------------------+
//| Custom indicator initialization function                         |
//+------------------------------------------------------------------+
int init()
  {
   string short_name;

   IndicatorBuffers(2);
   IndicatorDigits(Digits);
//---- indicator line
   SetIndexStyle(0,DRAW_HISTOGRAM,0,histowidth);
   SetIndexBuffer(0,BBUP);

   SetIndexStyle(1,DRAW_HISTOGRAM,0,histowidth);
   SetIndexBuffer(1,BBDOWN);

  // SetIndexStyle(2,DRAW_LINE);
  // SetIndexBuffer(2, avg);

//---- name for DataWindow and indicator subwindow label
   short_name="Bull Bears("+BBPeriod+")";
   IndicatorShortName(short_name);
   SetIndexLabel(0,short_name);
//----

   return(0);
  }
//+------------------------------------------------------------------+
//| Bears Power                                                      |
//+------------------------------------------------------------------+
int start()
  {
   int    counted_bars=IndicatorCounted();
   int limit,i;

   if(counted_bars<0) return(-1);
   if(counted_bars>0) counted_bars--;
   limit=Bars-counted_bars;

   for(i=limit; i>=0; i--)
   {
   val = High[i]  - iMA(NULL,0,BBPeriod,0,mamode,price,i) + Low[i] - iMA(NULL,0,BBPeriod,0,mamode,price,i);

   //for(i=limit; i>=0; i--)
  // {
  // avg[i] = iMAOnArray(NULL,0,BBPeriod,0,mamode,i);

   if (val <= selllevel){
   BBDOWN[i] = val;
   BBUP[i] = 0;
   if (i == 1 && flagval1==0)
   {
   flagval1=1;
   flagval2=0;
   if (AlertON) Alert("Bull Bear Sell signal at Ask=",Ask,"\n Bid=",Bid,"\n Time=",TimeToStr(CurTime(),TIME_DATE)," ",TimeHour(CurTime()),":",TimeMinute(CurTime()),"\n Symbol=",Symbol()," Period=",Period());
   if (EmailON) SendMail("Bull Bear Sell alert","Sell signal at Ask="+DoubleToStr(Ask,4)+", Bid="+DoubleToStr(Bid,4)+", Date="+TimeToStr(CurTime(),TIME_DATE)+" "+TimeHour(CurTime())+":"+TimeMinute(CurTime())+" Symbol="+Symbol()+" Period="+Period());
   if (SoundON) PlaySound(SoundFileName);
   }
   }
   else if (val > buylevel)
   {
   BBDOWN[i] = 0;
   BBUP[i] = val;
   if (i == 1 && flagval2==0)
   {
   flagval2=1;
   flagval1=0;
   if (AlertON) Alert("Bull Bear Buy signal at Ask=",Ask,"\n Bid=",Bid,"\n Date=",TimeToStr(CurTime(),TIME_DATE)," ",TimeHour(CurTime()),":",TimeMinute(CurTime()),"\n Symbol=",Symbol()," Period=",Period());
   if (EmailON) SendMail("Bull Bear Buy signal alert","Buy signal at Ask="+DoubleToStr(Ask,4)+", Bid="+DoubleToStr(Bid,4)+", Date="+TimeToStr(CurTime(),TIME_DATE)+" "+TimeHour(CurTime())+":"+TimeMinute(CurTime())+" Symbol="+Symbol()+" Period="+Period());
   if (SoundON) PlaySound(SoundFileName);
   }
  }
 }
return(0);
}
Comments