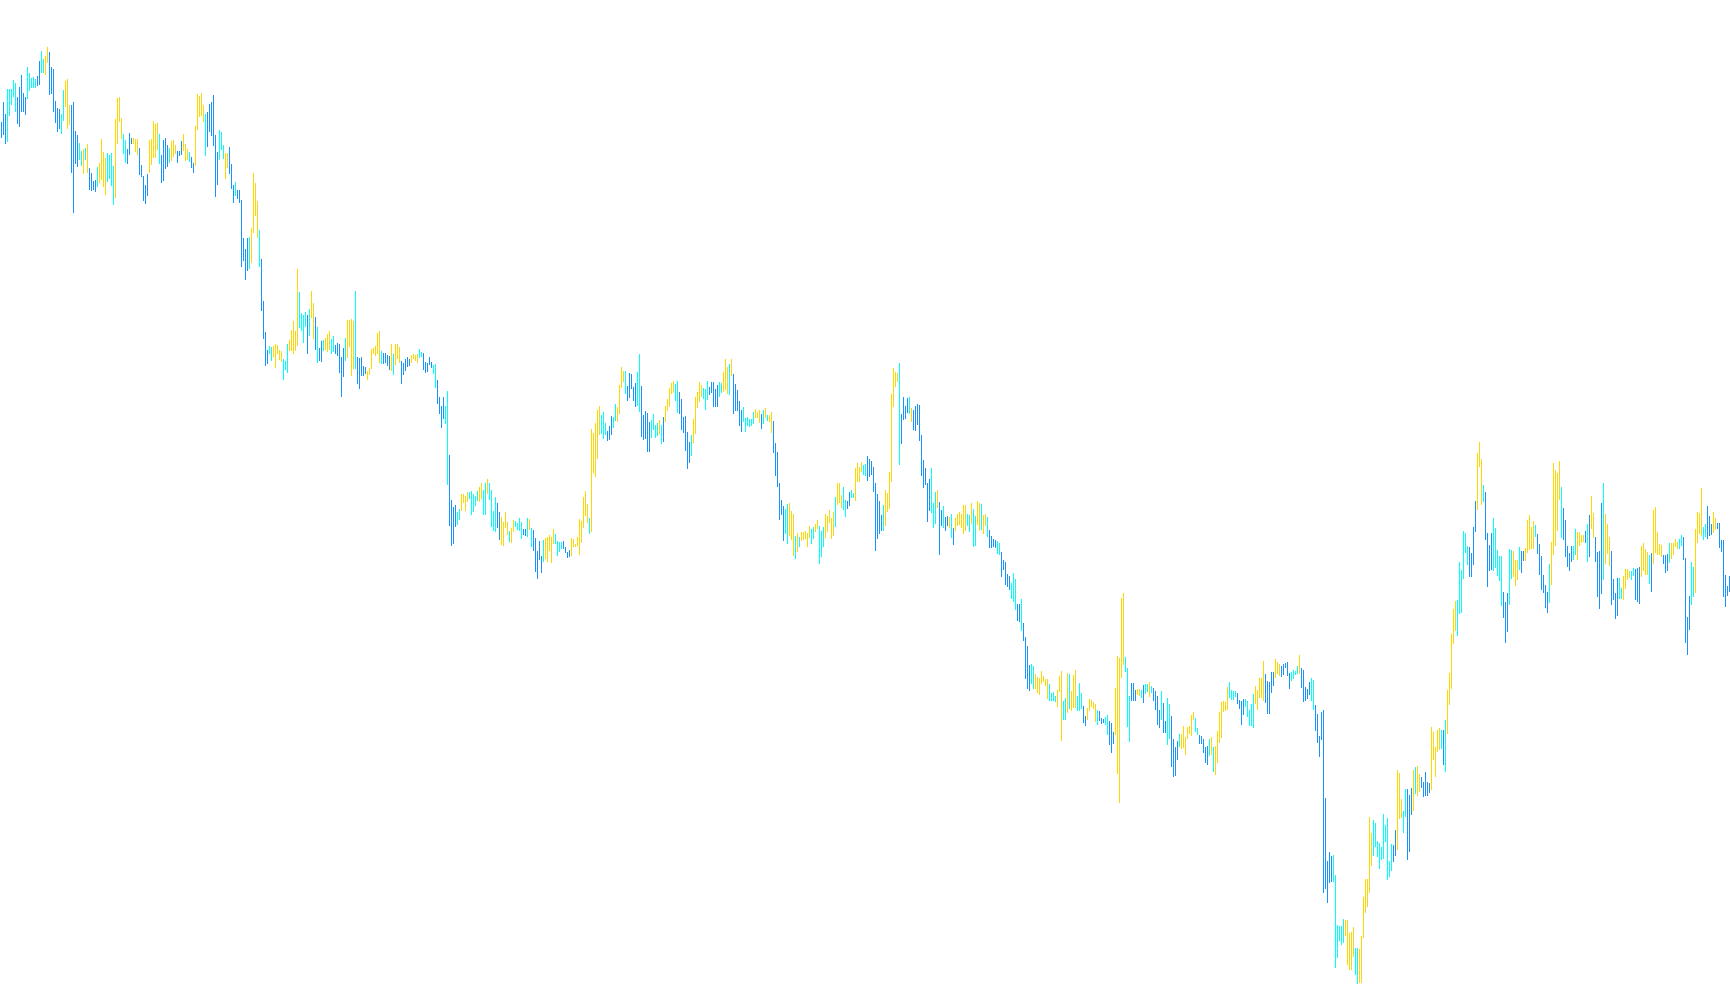
The BW-Zone indicator is designed to provide visual clarity on market trends by identifying specific price action zones based on the interaction between momentum and trend indicators. Instead of simply showing every price movement, this tool filters market data to highlight significant directional shifts.
How the Logic Works
The script monitors the market by comparing current price data against two primary technical metrics: the Awesome Oscillator (AO) and the AC Indicator. By analyzing these together, the tool categorizes each candle into one of three distinct zones:
1. Bullish Momentum Zone (Upward Trend) The indicator looks for a "double confirmation" where both the Awesome Oscillator and the AC Indicator are rising simultaneously. When this happens, the script marks a positive zone. Visually, this highlights areas where the market is gaining strength, helping traders identify periods of aggressive buying interest.
2. Bearish Momentum Zone (Downward Trend) Conversely, the tool monitors for instances where both the Awesome Oscillator and the AC Indicator are falling at the same time. When these two metrics move down in unison, the script identifies a negative zone. This helps highlight areas of selling pressure and downward momentum.
3. Neutral/Transition Zone (Consolidation) In cases where neither of the above conditions is met—meaning the indicators aren't showing a clear, synchronized trend—the script categorizes the movement as a neutral zone. This represents periods of market indecision or sideways movement, providing a visual "buffer" between stronger bullish and bearish trends.
Summary for the Trader
By using this logic, the BW-Zone simplifies your chart. Rather than forcing you to constantly read raw oscillator values, it translates that data into visual zones on your price candles. This allows you to quickly distinguish between:
- Confirmed Upward Strength (Momentum is synchronized upward)
- Confirmed Downward Strength (Momentum is synchronized downward)
- Neutral Market Activity (No clear directional trend detected)
//+------------------------------------------------------------------+
//|                                                      BW-Zone.mq4 |
//|                                             © 2009, SVK Software |
//|                                                                  |
//+------------------------------------------------------------------+
#property copyright "© 2009, SVK Software"
#property link      ""

#property indicator_chart_window
#property indicator_buffers 6
#property indicator_color1 Lime
#property indicator_color2 Lime
#property indicator_color3 Red
#property indicator_color4 Red
#property indicator_color5 Gray
#property indicator_color6 Gray

#property indicator_width1 1
#property indicator_width2 1
#property indicator_width3 1
#property indicator_width4 1
#property indicator_width5 1
#property indicator_width6 1

//---- buffers
double UpBuffer1[];
double DnBuffer1[];
double UpBuffer2[];
double DnBuffer2[];
double UpBuffer3[];
double DnBuffer3[];
int    BarsCount;
int    Length = 100;
int    limit;
//+------------------------------------------------------------------+
//| Custom indicator initialization function                         |
//+------------------------------------------------------------------+
int init()
  {
//---- indicators
   SetIndexStyle(0,DRAW_HISTOGRAM);
   SetIndexBuffer(0,UpBuffer1);
   SetIndexStyle(1,DRAW_HISTOGRAM);
   SetIndexBuffer(1,DnBuffer1);
   SetIndexStyle(2,DRAW_HISTOGRAM);
   SetIndexBuffer(2,UpBuffer2);
   SetIndexStyle(3,DRAW_HISTOGRAM);
   SetIndexBuffer(3,DnBuffer2);
   SetIndexStyle(4,DRAW_HISTOGRAM);
   SetIndexBuffer(4,UpBuffer3);
   SetIndexStyle(5,DRAW_HISTOGRAM);
   SetIndexBuffer(5,DnBuffer3);
//----
 /*
   SetIndexDrawBegin(0,Length);
   SetIndexDrawBegin(1,Length);
   SetIndexDrawBegin(2,Length);
   SetIndexDrawBegin(3,Length);
   SetIndexDrawBegin(4,Length);
   SetIndexDrawBegin(5,Length);
 */
//----
   return(0);
  }
//+------------------------------------------------------------------+
//| Custom indicator deinitialization function                       |
//+------------------------------------------------------------------+
int deinit()
  {
//----

//----
   return(0);
  }
//+------------------------------------------------------------------+
//| Custom indicator iteration function                              |
//+------------------------------------------------------------------+
int start()
  {
   int  i, BarsCount = IndicatorCounted();
//----
   if(Bars<=Length) return(0);
//---- initial zero
   if(BarsCount < 1)
      for(i=1;i<=Length;i++)
         {
          UpBuffer1[Bars-i]=0.0;
          UpBuffer2[Bars-i]=0.0;
          UpBuffer3[Bars-i]=0.0;

          DnBuffer1[Bars-i]=0.0;
          DnBuffer2[Bars-i]=0.0;
          DnBuffer3[Bars-i]=0.0;
         }
   if ( BarsCount >  0 )  limit = Bars - BarsCount;
   if ( BarsCount == 0 )  limit = Bars - Length - 1;

   for(i=limit;i>=0;i--)
      {
       UpBuffer1[i] =EMPTY;
       UpBuffer2[i] =EMPTY;
       UpBuffer3[i] =EMPTY;

       DnBuffer1[i] =EMPTY;
       DnBuffer2[i] =EMPTY;
       DnBuffer3[i] =EMPTY;
       if (iAO(NULL,0,i) > iAO(NULL,0,i+1) && iAC(NULL,0,i) > iAC(NULL,0,i+1))
         {
          UpBuffer1[i] = High[i];
          DnBuffer1[i] = Low[i];
         }
       else
       if (iAO(NULL,0,i) < iAO(NULL,0,i+1) && iAC(NULL,0,i) < iAC(NULL,0,i+1))
         {
          UpBuffer2[i] = Low[i];
          DnBuffer2[i] = High[i];
         }
       else
       if (UpBuffer1[i] == EMPTY && UpBuffer2[i] == EMPTY)
         {
          UpBuffer3[i] = High[i];
          DnBuffer3[i] = Low[i];
         }
      }
//----
   return(0);
  }
//+------------------------------------------------------------------+
Comments