camarilladt4
Download script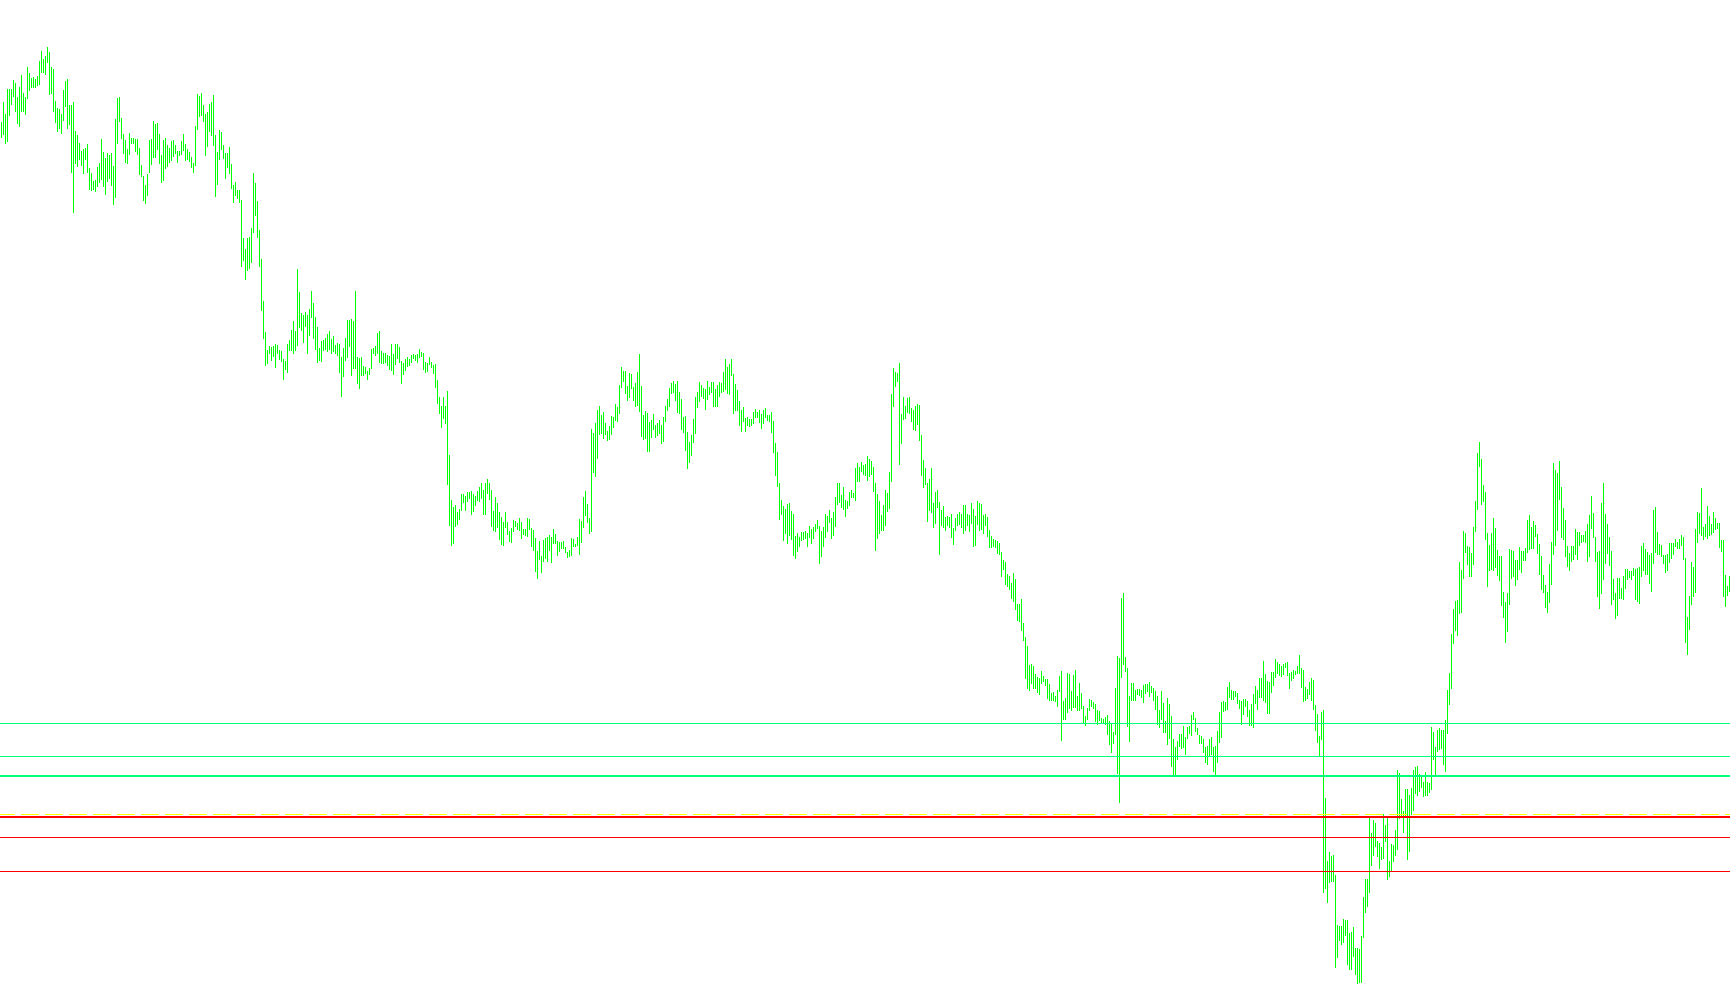
This script is a specialized financial analysis tool designed for the MetaTrader platform. It automatically identifies and plots key price levels on your trading charts to help determine potential support, resistance, and breakout zones based on historical price data.
Core Functionality
The tool primarily focuses on three types of technical analysis: Camarilla Pivot Points, Standard Pivot Points, and Fibonacci Retracements. By calculating these values automatically, it removes the need for manual calculation, allowing traders to see significant "turning points" in real-time.
Key Features and Logic
1. Automated Data Gathering The script scans historical price data to identify the high, low, and closing prices of the previous trading session. It uses these three core data points to calculate all subsequent levels for the current day.
2. Camarilla Pivot Levels This is a major feature of the tool. It calculates specific "Camarilla" levels which are often used by short-term traders to identify breakouts and reversals:
- H3 & L3: These are highlighted as primary "Short" and "Long" zones, respectively. They are treated as immediate areas where price might stall or reverse.
- H4 & L4: These represent "Breakout" levels. When the price moves beyond these lines, it often signals a stronger trend.
- H5 & L5: These are designated as "Target" levels, helping traders identify potential end-points for a current price move.
3. Pivot Points & Fibonacci Support The script offers optional layers of extra information:
- Standard Pivots: Calculates the central "Pivot" point and supporting lines.
- Fibonacci Levels: If enabled, the tool plots standard Fibonacci retracement levels (R1-R3 and S1-S3) based on the previous day's range. These provide additional zones where price action may slow down or react.
4. Visual Display & Dynamic Updates The script draws these levels as horizontal lines directly on your chart, complete with text labels for clarity. It is designed to be dynamic; as new days begin and prices change, the lines automatically reposition themselves to reflect the most current data. It also provides a summary "comment" on the corner of the chart showing the daily high, low, range, and closing price.
5. Intelligent Alert System To help traders who cannot watch the screen constantly, the script includes an automated alert system. It monitors the distance between the current market price and the critical H3 (Short) and L3 (Long) lines.
- If the price approaches these specific zones within a user-defined "Pip Distance," the tool will trigger a visual pop-up alert and play an audio sound.
- The logic includes a "first-time" filter to ensure you are notified only when the price first enters these zones, preventing your screen from being flooded with repeated alerts during a single move.
Usage Context
This tool is intended for traders who prefer a "levels-based" approach to the markets. By identifying where the "walls" (resistance) and "floors" (support) are likely to be located based on previous daily performance, it helps in making more informed decisions regarding entry and exit points.
//+------------------------------------------------------------------+
//|                                                  camarilladt.mq4 |
//|                      Copyright © 2005, MetaQuotes Software Corp. |
//|                                        http://www.metaquotes.net |
//+------------------------------------------------------------------+
#property copyright "Copyright © 2005, MetaQuotes Software Corp."
#property link      "http://www.metaquotes.net"

#property indicator_chart_window
//---- input parameters
extern bool Alerts = true;
extern int  GMTshift=0;
extern bool Pivot = true;
extern color PivotColor = Yellow;
extern color PivotFontColor = White;
extern int PivotFontSize = 8;
extern int PivotWidth = 1;
extern int PipDistance = 20;
extern color CamFontColor = White;
extern int CamFontSize = 10;
extern bool Fibs = false;
extern color FibColor = Sienna;
extern color FibFontColor = White;
extern int FibFontSize = 8;

double P, H3, H4, H5;
double L3, L4, L5;
double LastHigh,LastLow,x;
bool firstL3=true;
bool firstH3=true;

double D1=0.091667;
double D2=0.183333;
double D3=0.2750;
double D4=0.55;


// Fib variables

double yesterday_high=0;
double yesterday_low=0;
double yesterday_close=0;
double r3=0;
double r2=0;
double r1=0;
double p=0;
double s1=0;
double s2=0;
double s3=0;
double R;

//+------------------------------------------------------------------+
//| Custom indicator initialization function                         |
//+------------------------------------------------------------------+
int init()
  {
//---- indicators
//----
   return(0);
  }
//+------------------------------------------------------------------+
//| Custor indicator deinitialization function                       |
//+------------------------------------------------------------------+
int deinit()
  {
//---- TODO: add your code here
if (Fibs)
{ObjectDelete("R1 Label");
ObjectDelete("R1 Line");
ObjectDelete("R2 Label");
ObjectDelete("R2 Line");
ObjectDelete("R3 Label");
ObjectDelete("R3 Line");
ObjectDelete("S1 Label");
ObjectDelete("S1 Line");
ObjectDelete("S2 Label");
ObjectDelete("S2 Line");
ObjectDelete("S3 Label");
ObjectDelete("S3 Line");
}
if (Pivot)
{
ObjectDelete("P Label");
ObjectDelete("P Line");
}
ObjectDelete("H5 Label");
ObjectDelete("H5 Line");
ObjectDelete("H4 Label");
ObjectDelete("H4 Line");
ObjectDelete("H3 Label");
ObjectDelete("H3 Line");
ObjectDelete("L3 Label");
ObjectDelete("L3 Line");
ObjectDelete("L4 Label");
ObjectDelete("L4 Line");
ObjectDelete("L5 Label");
ObjectDelete("L5 Line");
//----
   return(0);
  }

int DoAlerts()
{
   double DifAboveL3,PipsLimit;
   double DifBelowH3;

   DifBelowH3 = H3 - Close[0];
   DifAboveL3 = Close[0] - L3;
   PipsLimit = PipDistance*Point;

   if (DifBelowH3 > PipsLimit) firstH3 = true;
   if (DifBelowH3 <= PipsLimit && DifBelowH3 > 0)
   {
    if (firstH3)
    {
      Alert("Below Cam H3 Line by ",DifBelowH3, " for ", Symbol(),"-",Period());
      PlaySound("timeout.wav");
      firstH3=false;
    }
   }

   if (DifAboveL3 > PipsLimit) firstL3 = true;
   if (DifAboveL3 <= PipsLimit && DifAboveL3 > 0)
   {
    if (firstL3)
    {
      Alert("Above Cam L3 Line by ",DifAboveL3," for ", Symbol(),"-",Period());
      PlaySound("timeout.wav");
      firstL3=false;
    }
   }

}


//+------------------------------------------------------------------+
//| Custom indicator iteration function                              |
//+------------------------------------------------------------------+
int start()
  {
   int    counted_bars=IndicatorCounted();
//---- TODO: add your code here
double day_high=0;
double day_low=0;
double yesterday_open=0;
double today_open=0;
double Q=0,S=0,R=0,nQ=0,nD=0,D=0;

int cnt=720;
double cur_day=0;
double prev_day=0;

double rates_d1[2][6];

//---- exit if period is greater than daily charts
if(Period() > 1440)
{
Print("Error - Chart period is greater than 1 day.");
return(-1); // then exit
}

//---- Get new daily prices & calculate pivots

while (cnt!= 0)
{
	cur_day = TimeDay(Time[cnt]- (GMTshift*3600));

	if (prev_day != cur_day)
	{
		yesterday_close = Close[cnt+1];
		today_open = Open[cnt];
		yesterday_high = day_high;
		yesterday_low = day_low;

		day_high = High[cnt];
		day_low  = Low[cnt];

		prev_day = cur_day;
	}

   if (High[cnt]>day_high)
   {
      day_high = High[cnt];
   }
   if (Low[cnt]<day_low)
   {
      day_low = Low[cnt];
   }

	cnt--;

}


D = (day_high - day_low);
Q = (yesterday_high - yesterday_low);
//------ Pivot Points ------

P = (yesterday_high + yesterday_low + yesterday_close)/3;//Pivot
//---- To display all 8 Camarilla pivots remove comment symbols below and
// add the appropriate object functions below
H5 = (yesterday_high/yesterday_low)*yesterday_close;
H4 = ((yesterday_high - yesterday_low)* D4) + yesterday_close;
H3 = ((yesterday_high - yesterday_low)* D3) + yesterday_close;
//H2 = ((yesterday_high - yesterday_low) * D2) + yesterday_close;
//H1 = ((yesterday_high - yesterday_low) * D1) + yesterday_close;

//L1 = yesterday_close - ((yesterday_high - yesterday_low)*(D1));
//L2 = yesterday_close - ((yesterday_high - yesterday_low)*(D2));
L3 = yesterday_close - ((yesterday_high - yesterday_low)*(D3));
L4 = yesterday_close - ((yesterday_high - yesterday_low)*(D4));
L5 = yesterday_close - (H5 - yesterday_close);

if (Fibs)
{
      R = yesterday_high - yesterday_low;//range
      p = (yesterday_high + yesterday_low + yesterday_close)/3;// Standard Pivot
      r1 = p + (R * 0.38);
      r2 = p + (R * 0.62);
      r3 = p + (R * 0.99);
      s1 = p - (R * 0.38);
      s2 = p - (R * 0.62);
      s3 = p - (R * 0.99);
}

//comment on OHLC and daily range

if (Q > 5)
{
	nQ = Q;
}
else
{
	nQ = Q*10000;
}

if (D > 5)
{
	nD = D;
}
else
{
	nD = D*10000;
}

 if (StringSubstr(Symbol(),3,3)=="JPY")
      {
      nQ=nQ/100;
      nD=nD/100;
      }

Comment("High= ",yesterday_high,"    Previous Days Range= ",nQ,"\nLow= ",yesterday_low,"    Current Days Range= ",nD,"\nClose= ",yesterday_close);

//---- Set line labels on chart window
 if (Pivot)
   {

      if(ObjectFind("P label") != 0)
      {
      ObjectCreate("P label", OBJ_TEXT, 0, Time[0], P);
      ObjectSetText("P label", "Pivot", PivotFontSize, "Arial", PivotFontColor);
      }
      else
      {
      ObjectMove("P label", 0, Time[0], P);
      }

//---  Draw  Pivot lines on chart

      if(ObjectFind("P line") != 0)
      {
      ObjectCreate("P line", OBJ_HLINE, 0, Time[40], P);
      ObjectSet("P line", OBJPROP_STYLE, STYLE_DASH);
      ObjectSet("P line", OBJPROP_COLOR, PivotColor);
      }
      else
      {
      ObjectMove("P line", 0, Time[40], P);
      }

  }

  if (Fibs)
  {
      if(ObjectFind("R1 label") != 0)
      {
        ObjectCreate("R1 label", OBJ_TEXT, 0, 0, 0);
        ObjectSetText("R1 label", "Fib R1", FibFontSize, "Arial", FibFontColor);
      }
      else
      {
        ObjectMove("R1 label", 0, Time[0], r1);
      }
      if(ObjectFind("R2 label") != 0)
      {
        ObjectCreate("R2 label", OBJ_TEXT, 0, 0, 0);
        ObjectSetText("R2 label", "Fib R2", FibFontSize, "Arial", FibFontColor);
      }
      else
      {
        ObjectMove("R2 label", 0, Time[0], r2);
      }
      if(ObjectFind("R3 label") != 0)
      {
        ObjectCreate("R3 label", OBJ_TEXT, 0, 0, 0);
        ObjectSetText("R3 label", "Fib R3", FibFontSize, "Arial", FibFontColor);
      }
      else
      {
        ObjectMove("R3 label", 0, Time[0], r3);
      }
      if(ObjectFind("S1 label") != 0)
      {
        ObjectCreate("S1 label", OBJ_TEXT, 0, 0, 0);
        ObjectSetText("S1 label", "Fib S1", FibFontSize, "Arial", FibFontColor);
      }
      else
      {
        ObjectMove("S1 label", 0, Time[0], s1);
      }
      if(ObjectFind("S2 label") != 0)
      {
        ObjectCreate("S2 label", OBJ_TEXT, 0, 0, 0);
        ObjectSetText("S2 label", "Fib S2", FibFontSize, "Arial", FibFontColor);
      }
      else
      {
        ObjectMove("S2 label", 0, Time[0], s2);
      }
      if(ObjectFind("S3 label") != 0)
      {
        ObjectCreate("S3 label", OBJ_TEXT, 0, 0, 0);
        ObjectSetText("S3 label", "Fib S3", FibFontSize, "Arial", FibFontColor);
      }
      else
      {
        ObjectMove("S3 label", 0, Time[0], s3);
      }

//---- Set lines on chart window

      if(ObjectFind("S1 line") != 0)
      {
        ObjectCreate("S1 line", OBJ_HLINE, 0, 0, 0);
        ObjectSet("S1 line", OBJPROP_STYLE, STYLE_DASHDOTDOT);
        ObjectSet("S1 line", OBJPROP_COLOR, FibColor);
      }
      else
      {
        ObjectMove("S1 line", 0, Time[0], s1);
      }
      if(ObjectFind("S2 line") != 0)
      {
        ObjectCreate("S2 line", OBJ_HLINE, 0, 0, 0);
        ObjectSet("S2 line", OBJPROP_STYLE, STYLE_DASHDOTDOT);
        ObjectSet("S2 line", OBJPROP_COLOR, FibColor);
      }
      else
      {
        ObjectMove("S2 line", 0, Time[0], s2);
      }
      if(ObjectFind("S3 line") != 0)
      {
        ObjectCreate("S3 line", OBJ_HLINE, 0, 0, 0);
        ObjectSet("S3 line", OBJPROP_STYLE, STYLE_DASHDOTDOT);
        ObjectSet("S3 line", OBJPROP_COLOR, FibColor);
      }
      else
      {
        ObjectMove("S3 line", 0, Time[0], s3);
      }
      if(ObjectFind("R1 line") != 0)
      {
        ObjectCreate("R1 line", OBJ_HLINE, 0, 0, 0);
        ObjectSet("R1 line", OBJPROP_STYLE, STYLE_DASHDOTDOT);
        ObjectSet("R1 line", OBJPROP_COLOR, FibColor);
      }
      else
      {
        ObjectMove("R1 line", 0, Time[0], r1);
      }
      if(ObjectFind("R2 line") != 0)
      {
        ObjectCreate("R2 line", OBJ_HLINE, 0, 0, 0);
        ObjectSet("R2 line", OBJPROP_STYLE, STYLE_DASHDOTDOT);
        ObjectSet("R2 line", OBJPROP_COLOR, FibColor);
      }
      else
      {
        ObjectMove("R2 line", 0, Time[0], r2);
      }
      if(ObjectFind("R3 line") != 0)
      {
        ObjectCreate("R3 line", OBJ_HLINE, 0, 0, 0);
        ObjectSet("R3 line", OBJPROP_STYLE, STYLE_DASHDOTDOT);
        ObjectSet("R3 line", OBJPROP_COLOR, FibColor);
      }
      else
      {
        ObjectMove("R3 line", 0, Time[0], r3);
      }

  }


// --- THE CAMARILLA ---
   if(ObjectFind("H5 label") != 0)
      {
      ObjectCreate("H5 label", OBJ_TEXT, 0, Time[20], H5);
      ObjectSetText("H5 label", " H5 LB TARGET", CamFontSize, "Arial", CamFontColor);
      }
      else
      {
      ObjectMove("H5 label", 0, Time[20], H5);
      }

      if(ObjectFind("H4 label") != 0)
      {
      ObjectCreate("H4 label", OBJ_TEXT, 0, Time[20], H4);
      ObjectSetText("H4 label", " H4 LONG BREAKOUT", CamFontSize, "Arial", CamFontColor);
      }
      else
      {
      ObjectMove("H4 label", 0, Time[20], H4);
      }

      if(ObjectFind("H3 label") != 0)
      {
      ObjectCreate("H3 label", OBJ_TEXT, 0, Time[20], H3);
      ObjectSetText("H3 label", " H3 SHORT", CamFontSize, "Arial", CamFontColor);
      }
      else
      {
      ObjectMove("H3 label", 0, Time[20], H3);
      }

      if(ObjectFind("L3 label") != 0)
      {
      ObjectCreate("L3 label", OBJ_TEXT, 0, Time[20], L3);
      ObjectSetText("L3 label", " L3 LONG", CamFontSize, "Arial", CamFontColor);
      }
      else
      {
      ObjectMove("L3 label", 0, Time[20], L3);
      }

      if(ObjectFind("L4 label") != 0)
      {
      ObjectCreate("L4 label", OBJ_TEXT, 0, Time[20], L4);
      ObjectSetText("L4 label", " L4 SHORT BREAKOUT", CamFontSize, "Arial", CamFontColor);
      }
      else
      {
      ObjectMove("L4 label", 0, Time[20], L4);
      }

      if(ObjectFind("L5 label") != 0)
      {
      ObjectCreate("L5 label", OBJ_TEXT, 0, Time[20], L5);
      ObjectSetText("L5 label", " L5 SB TARGET", CamFontSize, "Arial", CamFontColor);
      }
      else
      {
      ObjectMove("L5 label", 0, Time[20], L5);
      }

//---- Draw Camarilla lines on Chart
      if(ObjectFind("H5 line") != 0)
      {
      ObjectCreate("H5 line", OBJ_HLINE, 0, Time[40], H5);
      ObjectSet("H5 line", OBJPROP_STYLE, STYLE_SOLID);
      ObjectSet("H5 line", OBJPROP_COLOR, SpringGreen);
      ObjectSet("H5 line", OBJPROP_WIDTH, 1);
      }
      else
      {
      ObjectMove("H5 line", 0, Time[40], H5);
      }

      if(ObjectFind("H4 line") != 0)
      {
      ObjectCreate("H4 line", OBJ_HLINE, 0, Time[40], H4);
      ObjectSet("H4 line", OBJPROP_STYLE, STYLE_SOLID);
      ObjectSet("H4 line", OBJPROP_COLOR, SpringGreen);
      ObjectSet("H4 line", OBJPROP_WIDTH, 1);
      }
      else
      {
      ObjectMove("H4 line", 0, Time[40], H4);
      }

      if(ObjectFind("H3 line") != 0)
      {
      ObjectCreate("H3 line", OBJ_HLINE, 0, Time[40], H3);
      ObjectSet("H3 line", OBJPROP_STYLE, STYLE_SOLID);
      ObjectSet("H3 line", OBJPROP_COLOR, SpringGreen);
      ObjectSet("H3 line", OBJPROP_WIDTH, 2);
      }
      else
      {
      ObjectMove("H3 line", 0, Time[40], H3);
      }

      if(ObjectFind("L3 line") != 0)
      {
      ObjectCreate("L3 line", OBJ_HLINE, 0, Time[40], L3);
      ObjectSet("L3 line", OBJPROP_STYLE, STYLE_SOLID);
      ObjectSet("L3 line", OBJPROP_COLOR, Red);
      ObjectSet("L3 line", OBJPROP_WIDTH, 2);
      }
      else
      {
      ObjectMove("L3 line", 0, Time[40], L3);
      }

      if(ObjectFind("L4 line") != 0)
      {
      ObjectCreate("L4 line", OBJ_HLINE, 0, Time[40], L4);
      ObjectSet("L4 line", OBJPROP_STYLE, STYLE_SOLID);
      ObjectSet("L4 line", OBJPROP_COLOR, Red);
      ObjectSet("L4 line", OBJPROP_WIDTH, 1);
      }
      else
      {
      ObjectMove("L4 line", 0, Time[40], L4);
      }

      if(ObjectFind("L5 line") != 0)
      {
      ObjectCreate("L5 line", OBJ_HLINE, 0, Time[40], L5);
      ObjectSet("L5 line", OBJPROP_STYLE, STYLE_SOLID);
      ObjectSet("L5 line", OBJPROP_COLOR, Red);
      ObjectSet("L5 line", OBJPROP_WIDTH, 1);
      }
      else
      {
      ObjectMove("L5 line", 0, Time[40], L5);
      }

//---- done
   // Now check for Alert

   if (Alerts) DoAlerts();

//----
   return(0);
  }
//+------------------------------------------------------------------+
Comments