CandleSizeAlert
Download script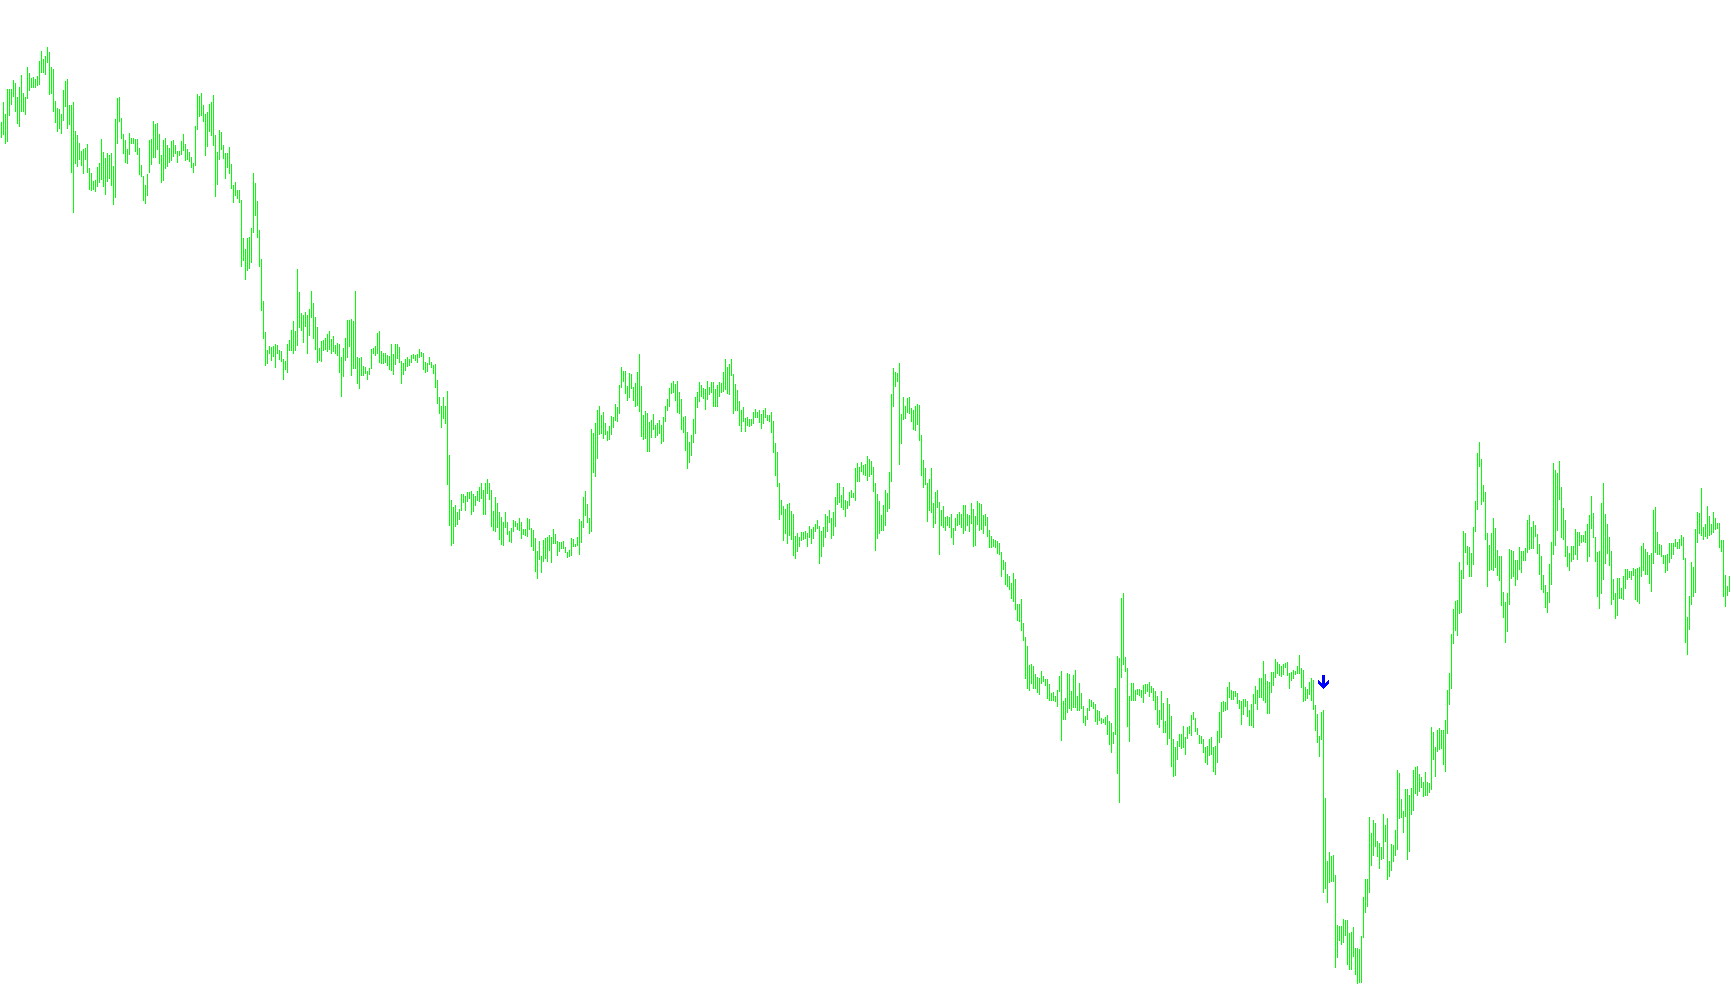
This script is a specialized monitoring tool designed to track significant price movements in real-time by identifying "large" candles based on specific size criteria. Instead of simply looking at the price, it focuses on the magnitude of the candle's body relative to recent market activity.
How the Logic Works
1. Dynamic Range Assessment The tool does not rely on a fixed price distance alone. It constantly analyzes the most recent 10 candles to calculate an average range (the difference between the high and low prices). By doing this, it establishes a baseline for what "normal" volatility looks like in the current market environment.
2. Size Detection
For every new candle that forms, the script calculates the distance between the opening price and the closing price. It then compares this distance against a user-defined threshold (the CandleSize). If the movement exceeds this threshold, the script identifies it as a significant event.
3. Directional Analysis Once a large candle is detected, the tool determines its direction:
- Bearish Movement: If the price closed lower than it opened, it marks the move as "Bearish."
- Bullish Movement: If the price closed higher than it opened, it marks the move as "Bullish."
4. Automated Alerts and Visual Aids When a significant candle meets your criteria, the script performs two main actions:
- Visual Markers: It places specific markers on your chart—Green for Bullish movements and Red for Bearish movements—positioned slightly outside the candle's high or low range to make them easy to spot.
- Notifications: If enabled, the tool will trigger a pop-up alert providing the exact time, symbol, and timeframe of the movement.
5. Smart Filtering To prevent your screen from being flooded with notifications, the script includes an intelligent "flag" system. This ensures that you only receive one alert per significant move, preventing repetitive notifications for the same candle while ensuring you are notified the moment a major price shift occurs.
//compile//
//+------------------------------------------------------------------+
//|                                              CandleSizeAlert.mq4 |
//|                         Copyright © 2008, Robert Hill            |
//|                                                                  |
//| Will send alert when a candle meets the size criteria entered   |
//+------------------------------------------------------------------+

#property copyright "Copyright © 2006, Robert Hill"

#property indicator_chart_window
#property indicator_buffers 2
#property indicator_color1 LawnGreen
#property indicator_color2 Red
#property indicator_width1  2
#property indicator_width2  2

extern bool AlertON=true;
extern int CandleSize = 50;

double Bull[];
double Bear[];
int flagval1 = 0;
int flagval2 = 0;
double   myPoint;

//+------------------------------------------------------------------+
//| Custom indicator initialization function                         |
//+------------------------------------------------------------------+
int init()
  {
//---- indicators
//   IndicatorBuffers(5);
   SetIndexStyle(0, DRAW_ARROW, EMPTY);
   SetIndexArrow(0, 233);
   SetIndexBuffer(0, Bull);
   SetIndexStyle(1, DRAW_ARROW, EMPTY);
   SetIndexArrow(1, 234);
   SetIndexBuffer(1, Bear);

     myPoint = SetPoint(Symbol());

//----
   return(0);
  }
//+------------------------------------------------------------------+
//| Custom indicator deinitialization function                       |
//+------------------------------------------------------------------+
int deinit()
  {
//----

//----
   return(0);
  }


//+------------------------------------------------------------------+
//| Custom indicator iteration function                              |
//+------------------------------------------------------------------+
int start() {
   double myOpen, myClose, myDif;
   int limit, i, counter;
   double tmp=0;
   double Range, AvgRange;
   datetime tc;

   int counted_bars=IndicatorCounted();
//---- check for possible errors
   if(counted_bars<0) return(-1);
//---- last counted bar will be recounted
   if(counted_bars>0) counted_bars--;

   limit=Bars-counted_bars;

   for(i = 0; i <= limit; i++) {

      counter=i;
      Range=0;
      AvgRange=0;
      for (counter=i ;counter<=i+9;counter++)
      {
         AvgRange=AvgRange+MathAbs(High[counter]-Low[counter]);
      }
      Range=AvgRange/10;

      myOpen = iOpen(NULL, 0, i);
      myClose = iClose(NULL, 0, i);
      myDif = NormalizeDouble(MathAbs(myOpen - myClose) / myPoint, 4);

      Bull[i] = 0;
      Bear[i] = 0;
      if (myDif > CandleSize)
      {
        if (myOpen > myClose)
        {
         if (i == 0 && flagval1==0)
         {
           flagval1=1;
           flagval2=0;
           tc = TimeCurrent();
           if (AlertON) Alert("Large BEAR candle","\n Time=",TimeToStr(tc,TIME_DATE)," ",TimeHour(tc),":",TimeMinute(tc),"\n Symbol=",Symbol()," Period=",Period());
         }
         Bear[i] = High[i] + Range*0.75;
        }
        else if (myOpen < myClose)
        {
         if (i == 0 && flagval2==0)
         {
          flagval2=1;
          flagval1=0;
          tc = TimeCurrent();
          if (AlertON) Alert("Large Bull candle","\n Date=",TimeToStr(tc,TIME_DATE)," ",TimeHour(tc),":",TimeMinute(tc),"\n Symbol=",Symbol()," Period=",Period());
         }
         Bull[i] = Low[i] - Range*0.75;
        }
      }
   }

   return(0);
}

double SetPoint(string mySymbol)
{
   double mPoint, myDigits;

   myDigits = MarketInfo (mySymbol, MODE_DIGITS);
   if (myDigits < 4)
      mPoint = 0.01;
   else
      mPoint = 0.0001;

   return(mPoint);
}
Comments