CandleStop_v1
Download script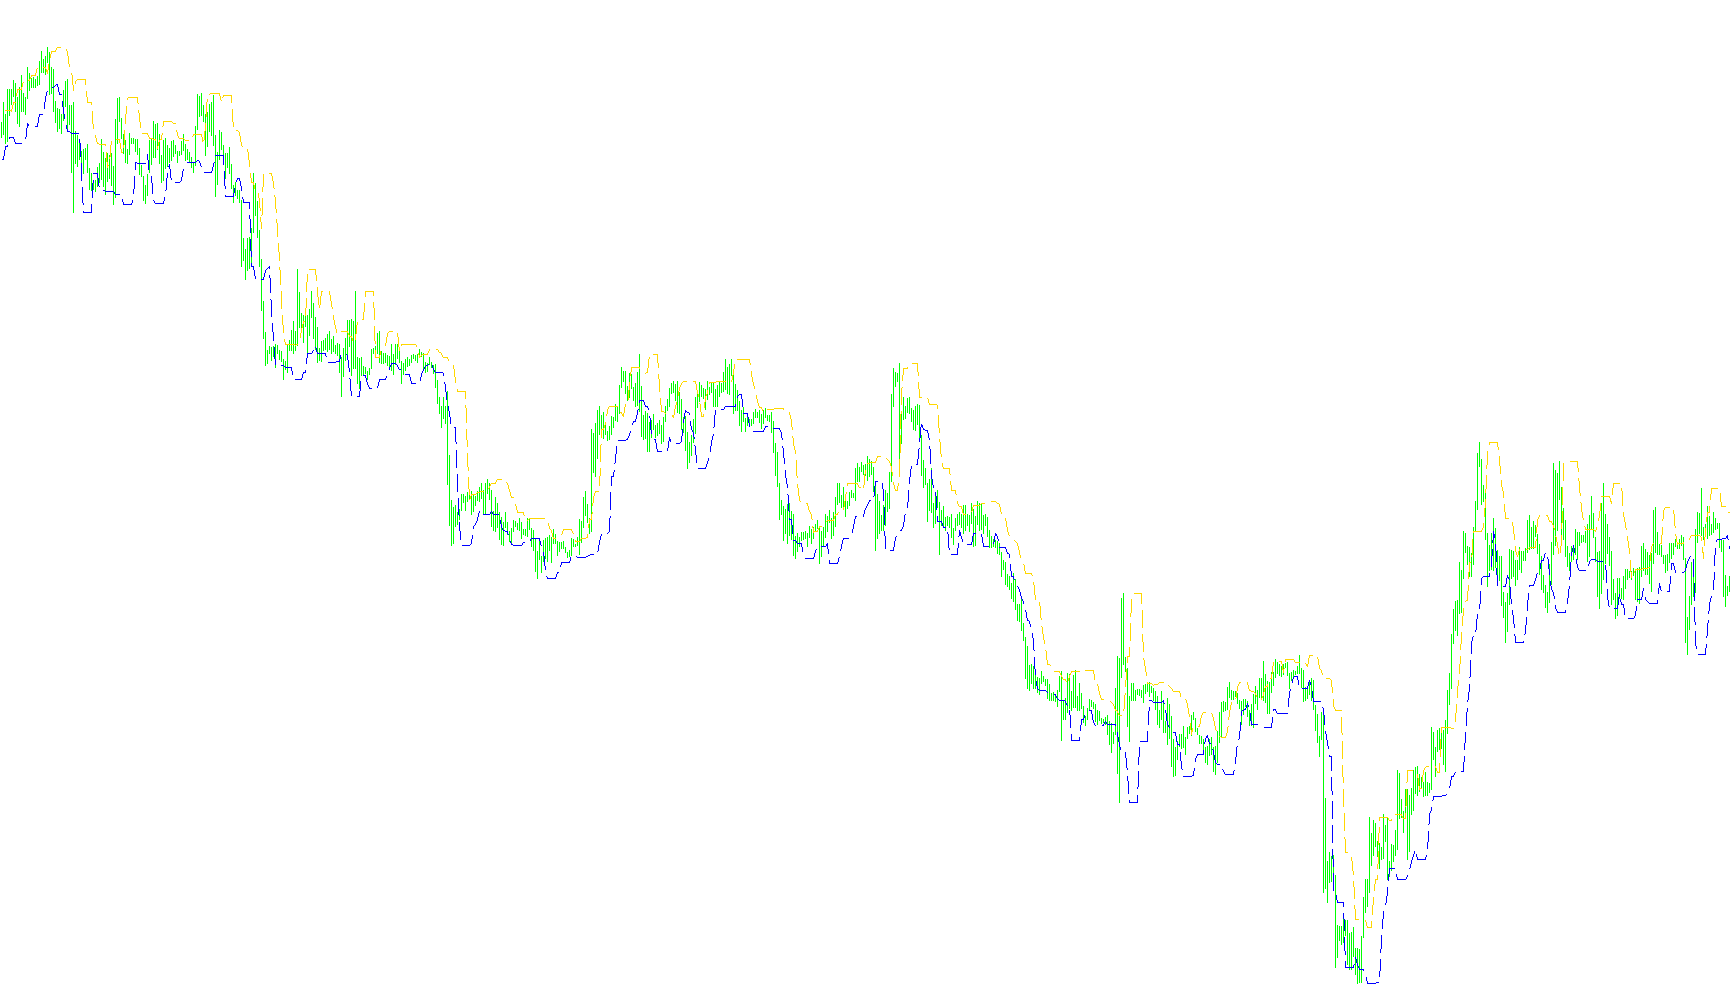
This script is a visual trading tool designed to help traders identify potential support and resistance levels on a price chart. It works by tracking the extreme price movements over a specific number of recent candles to create two dynamic "trail" lines.
How it Works
The logic focuses on identifying the boundaries of price action based on a user-defined timeframe (the "Trail Periods"). Instead of looking at just one candle, the script analyzes a moving window of price history to determine two specific values:
- The Short Trail Stop (Upper Boundary): The script looks back at the most recent candles and identifies the highest point reached during that period. It then plots a line on your chart representing this maximum peak. As new candles form and prices move, this line follows the highest "high" of the designated window.
- The Long Trail Stop (Lower Boundary): Conversely, the script identifies the lowest point reached during the same number of recent candles. It plots a line representing this minimum "low." This line tracks the bottom edge of recent price movement.
Visual Representation
On your trading chart, these two values appear as dashed lines:
- One line (Red) represents the upper threshold based on recent highs.
- One line (Green) represents the lower threshold based on recent lows.
Practical Purpose
By visualizing these two extremes simultaneously, the script provides a clear "channel" of recent price activity. Traders can use these lines to see where the market has historically struggled to break through or where it has found solid footing. Because the lines update automatically as new candles are created, they provide a real-time map of the market's current volatility and boundaries.
//+------------------------------------------------------------------+
//|                                                                  |
//|                                                                  |
//|                      File: CandleStop.mq4                        |
//|                      Author: CrushD                              |
//|                                                                  |
//+------------------------------------------------------------------+
#property copyright "CrushD"
//----
#property indicator_chart_window
#property indicator_buffers 2
#property indicator_color1 Red
#property indicator_color2 Green
//---- input parameters
extern int TrailPeriods=5;
//---- buffers
double LongTrailBuffer[];
double ShortTrailBuffer[];
//+------------------------------------------------------------------+
//| Custom indicator initialization function                         |
//+------------------------------------------------------------------+
int init()
  {
//---- indicators
   SetIndexStyle(0,DRAW_LINE, STYLE_DASH);
   SetIndexLabel(0, "Short Trail Stop");
   SetIndexBuffer(0,ShortTrailBuffer);
   SetIndexStyle(1,DRAW_LINE, STYLE_DASH);
   SetIndexLabel(1, "Long Trail Stop");
   SetIndexBuffer(1,LongTrailBuffer);
//----
   return(0);
  }
//+------------------------------------------------------------------+
//| Custor indicator deinitialization function                       |
//+------------------------------------------------------------------+
int deinit()
  {
//----
//----
   return(0);
  }
//+------------------------------------------------------------------+
//| Custom indicator iteration function                              |
//+------------------------------------------------------------------+
int start()
  {
   int counted_bars=IndicatorCounted();
   int i;
   if(counted_bars>0) counted_bars--;
   int limit=Bars-counted_bars;
   for(i=0; i<=limit; i++)
     {
      //calc short stop
      //Highest High of last n periods
      ShortTrailBuffer[i]=High[Highest(NULL, 0, MODE_HIGH, TrailPeriods, i+TrailPeriods)];
      //calc long stop
      //Lowest Low of last n periods
      LongTrailBuffer[i]=Low[Lowest(NULL, 0, MODE_LOW, TrailPeriods, i+TrailPeriods)];
     }
//----
   return(0);
  }
//+------------------------------------------------------------------+
Comments