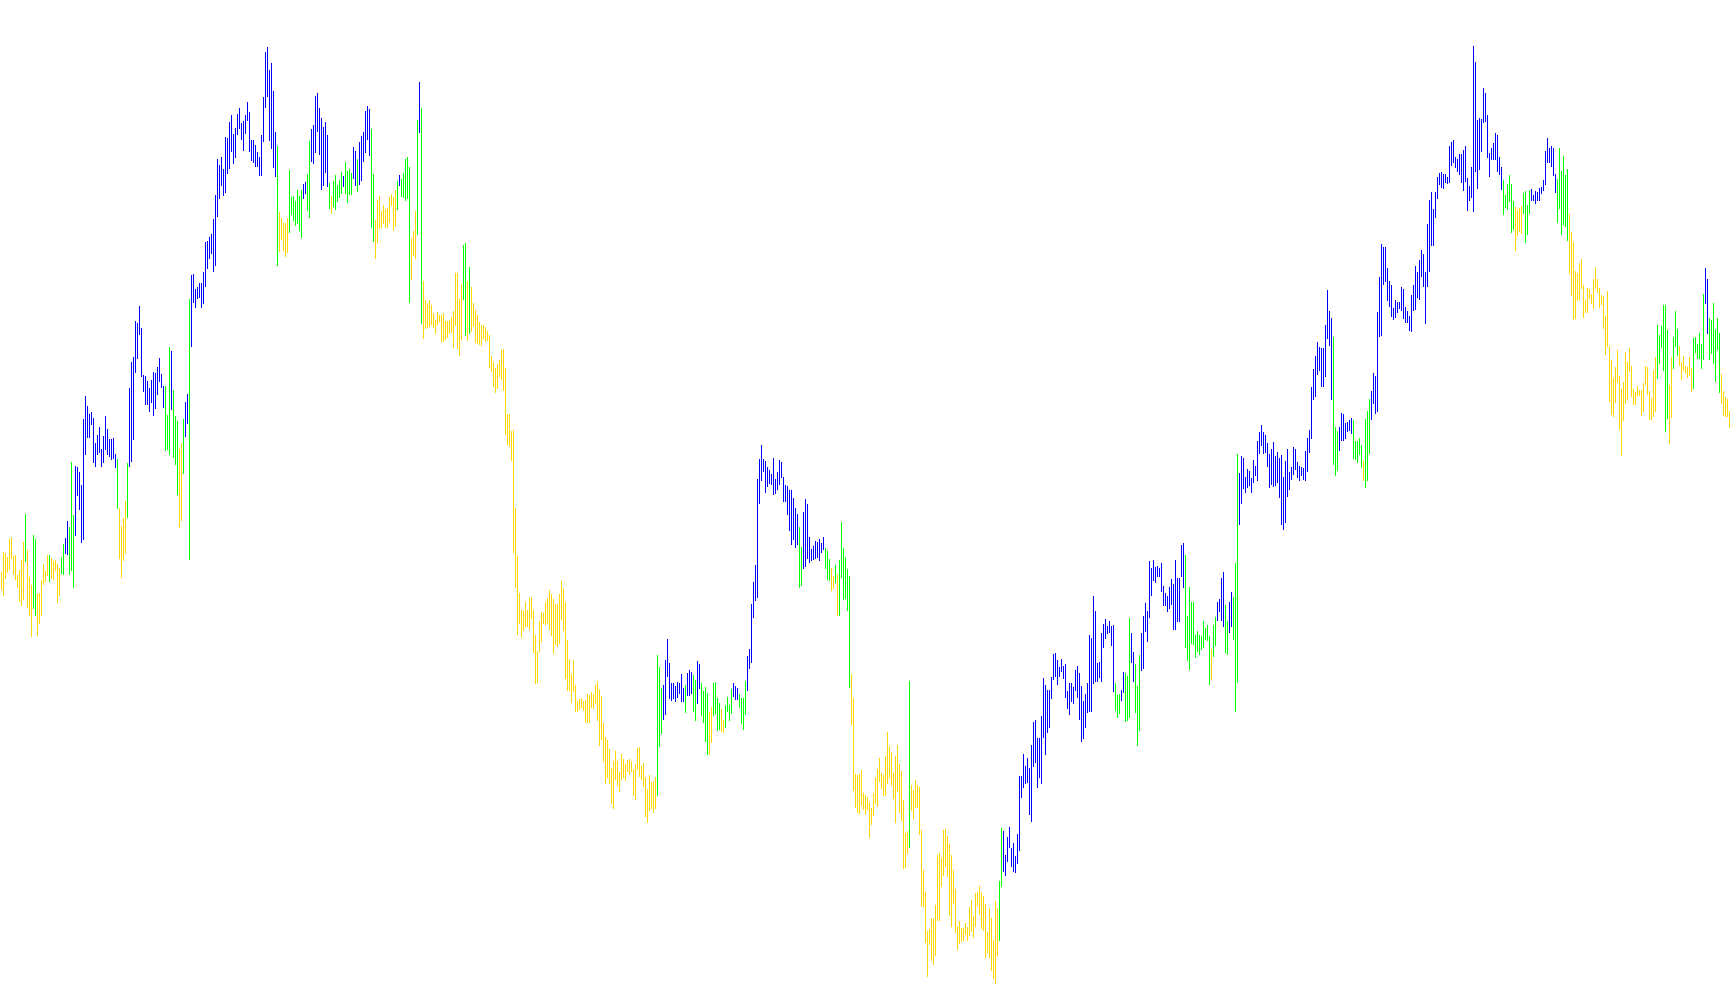
This tool is designed to provide a visual overlay on your trading charts, helping you quickly identify the relationship between current price action and a specific long-term trend. By analyzing the movement of price relative to a moving average, it highlights specific zones where the market is trending strongly in one direction or the other.
Core Logic Overview
The script works by constantly monitoring a "Moving Average"—a calculation that smooths out price data to show the general direction of the market over time. In this specific configuration, it looks at the 50-period Exponential Moving Average (EMA), which reflects the trend over the last 50 candles.
How it Identifies Market Behavior
The script examines every individual candle on your chart and compares its price range (the highest and lowest points) against that moving average. It classifies the market into three distinct states:
- Bearish Trend (Above the Average): If the moving average is positioned higher than the current candle's highest price, the script identifies this as a moment where the market is staying below a downward-sloping trend. It signals this by marking the area in Red.
- Bullish Trend (Below the Average): If the moving average is positioned lower than the current candle's lowest price, it indicates that the price is trending significantly above a rising baseline. The script signals this state in Green.
- Neutral/Transition Zone: If the price range of a candle overlaps with the moving average (meaning the candle is "touching" or "cutting through" the average), the script recognizes this as a moment of indecision or transition. In these cases, no color is applied to the chart, leaving the space empty.
Visual Purpose
For a trader, this logic serves as a visual filter. Instead of looking at raw price lines, you can see at a glance when the price has clearly detached from the moving average. It helps highlight "strong" moves where the market is pulling away from its mean, while filtering out the "noise" where the price is hovering around the average line.
//+------------------------------------------------------------------+
//|                                                  CatBarColor.mq4 |
//|                                                          Kalenzo |
//|                                      bartlomiej.gorski@gmail.com |
//+------------------------------------------------------------------+
#property copyright "Kalenzo"
#property link      "bartlomiej.gorski@gmail.com"

#property indicator_chart_window
#property indicator_color1 Red
#property indicator_color2 Green
#property indicator_buffers 2
double a[],b[];
//+------------------------------------------------------------------+
//| Custom indicator initialization function                         |
//+------------------------------------------------------------------+
int init()
  {
//---- indicators

   SetIndexStyle(0,DRAW_HISTOGRAM,0,1);
   SetIndexStyle(1,DRAW_HISTOGRAM,0,1);
   SetIndexBuffer(0,a);
   SetIndexBuffer(1,b);
   SetIndexLabel(0,"Above MA");
   SetIndexLabel(1,"Bellow MA");
//----
   return(0);
  }
//+------------------------------------------------------------------+
//| Custom indicator deinitialization function                       |
//+------------------------------------------------------------------+
int deinit()
  {
//----

//----
   return(0);
  }
//+------------------------------------------------------------------+
//| Custom indicator iteration function                              |
//+------------------------------------------------------------------+
int start()
  {

   int limit;
   int counted_bars=IndicatorCounted();
   if(counted_bars<0) counted_bars=0;
   if(counted_bars>0) counted_bars--;
   limit=Bars-counted_bars;

   for(int i = limit ;i >= 0  ;i--)
   {

      double ma = iMA(Symbol(),0,50,0,MODE_EMA,PRICE_CLOSE,i);

      if( ma > High[i] )
      {//red
         a[i] = High[i];
         b[i] = Low[i];
      }
      else if( ma < Low[i] )
      {//blue
         a[i] = Low[i];
         b[i] = High[i];
      }
      else
      {
         a[i]=EMPTY_VALUE;
         b[i]=EMPTY_VALUE;
      }
   }

   return(0);
  }
//+------------------------------------------------------------------+
Comments