cci_with_arrow
Download script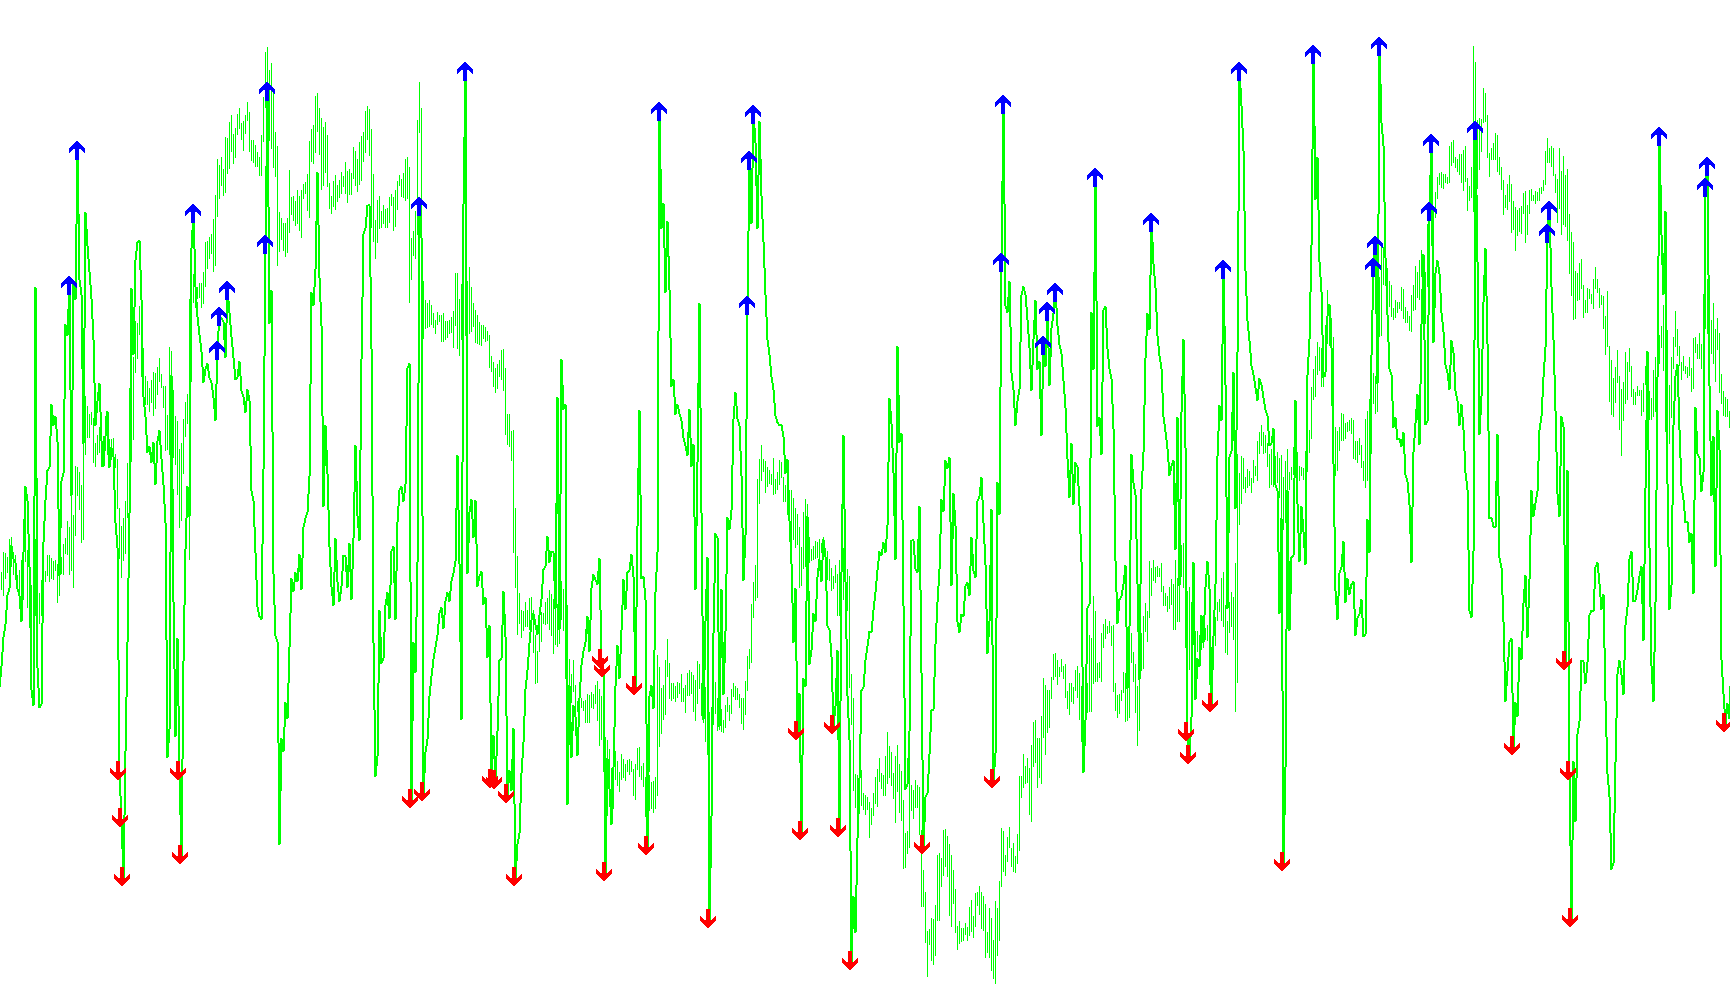
This script is a technical analysis tool designed for the MetaTrader platform to help traders identify potential price momentum shifts and reversal points. It functions by monitoring the Commodity Channel Index (CCI), which is a momentum-based oscillator used to determine if an asset is overbought, oversold, or trending strongly in one direction.
Core Functionality
The primary logic of this tool revolves around tracking extreme price movements. Instead of just showing a continuous line, the script scans historical and real-time data to identify specific "peaks" and "troughs" based on the following conditions:
- Overbought Identification: The script monitors when the CCI rises above the +100 threshold. When this happens, it looks for the highest point reached during that specific move.
- Oversold Identification: Conversely, it monitors when the CCI falls below the -100 threshold. It tracks these movements to find the lowest point reached during that downward trend.
Visual Signals (Arrows)
To make the data actionable for a trader, the script generates visual cues on the chart:
- Upward Arrows: These appear when the CCI reaches a new high while in overbought territory. This is intended to highlight areas where momentum has peaked significantly.
- Downward Arrows: These appear when the CCI reaches a new low while in oversold territory, highlighting potential exhaustion in a downward move.
Customization and Alerts
The script includes several "User-Defined" features that allow you to tailor the experience without changing the underlying logic:
- Visual Aids: You can enable vertical lines on the chart to mark specific price heights or signal lines, making it easier to see exactly where a peak occurred.
- Audio Notifications: The script can be configured to play a sound alert (a .wav file) at the exact moment a new high or low is detected, allowing you to monitor the market without constantly staring at the screen.
- Dynamic Coloring: The tool changes colors based on different timeframes or settings, helping to distinguish between various trading periods visually.
Summary for the User
In simple terms, this script acts as an automated "peak finder." It filters out the daily noise of the market and alerts you only when the momentum reaches extreme levels. By identifying these high and low extremes via arrows and sounds, it helps traders spot potential turning points in price action more efficiently than watching a standard oscillator manually.
//+------------------------------------------------------------------+
//|                                               cci with arrow.mq4 |
//|                                        StarLimit Software Corps. |
//|                                            starlimit03@yahoo.com |
//|               CREATED 08/05/2010(GOLDEN DAY)........3:45AM.......|
//+------------------------------------------------------------------+
#property copyright "StarLimit Software Corps."
#property link      "starlimit03@yahoo.com"

#property indicator_separate_window
#property indicator_buffers 3
#property  indicator_level1  100
#property  indicator_level2  -100
#property  indicator_level3  0
#property  indicator_level4  200
#property  indicator_level5  -200
#property  indicator_levelwidth  1
#property  indicator_levelcolor  Gold
#property  indicator_levelstyle  4


double uparrow[],downarrow[];
extern double barheight=300;
extern int BarCount=3000;
extern bool showheightline=false,showarrowline=false;
extern bool sound=false;
extern bool usechart=true;
extern int period=20;
extern int per=0;
datetime bartime;
extern int price_type=1;
extern string pair="EURUSD";
double cc[];
double lasthigh,high,highest,newhigh,lastlow,low,lowest,newlow;
color col=Lime;
double cci;
//+------------------------------------------------------------------+
//| Custom indicator initialization function                         |
//+------------------------------------------------------------------+
int init()
  {

if(usechart) {pair=Symbol();}
//---- indicators
//----
  for(int h=0;h<=Bars;h++)
      {

        ObjectDelete("UP"+h);
        ObjectDelete("SELL"+h);
      }
      string name="CCI with ARROW("+period+") on "+pair+per;
     if(per==5)col=Aqua;
    else if(per==15)col=Blue;
    else if(per==30)col=Coral;
    else if(per==60)col=Red;
     else col=Lime;
  IndicatorShortName(name);
   SetIndexStyle(0,DRAW_LINE,0,2,col);
   SetIndexBuffer(0,cc);
   SetIndexStyle(1, DRAW_ARROW,EMPTY,2,Blue);
   SetIndexBuffer(1, uparrow);
   SetIndexArrow(1, 233);
   SetIndexStyle(2, DRAW_ARROW,EMPTY,2,Red);
   SetIndexBuffer(2, downarrow);
   SetIndexArrow(2, 234);
   SetIndexEmptyValue(1,0);
   SetIndexEmptyValue(2,0);
   return(0);
  }
//+------------------------------------------------------------------+
//| Custom indicator deinitialization function                       |
//+------------------------------------------------------------------+
int deinit()
  {
//----
   for(int h=0;h<=Bars;h++)
      {
        ObjectDelete("UP"+h);
        ObjectDelete("SELL"+h);
      }
//----
   return(0);
  }
//+------------------------------------------------------------------+
//| Custom indicator iteration function                              |
//+------------------------------------------------------------------+
int start()
  {

   int Counted_bars=IndicatorCounted();
  int newbars = Bars-Counted_bars-1;
  if(IsConnected()) newbars=BarCount;

        // get last high...........

 highest=0; lasthigh=0;high=0;newhigh=0;lowest=200; int chan=0;int chan2=0;int bar=Bars;
 bool arrow=false,arrow2=false;

   for(int y=newbars;y>=0;y--)
    {

    datetime time=iTime(pair,Period(),y);
    int shift1=iBarShift(pair,per,time,true);
    cc[y] =iCCI(pair,per,period,price_type,shift1);

    cci=cc[y];//iCCI(pair,per,period,price_type,shift1);

   // get last high...........

       if(High[y]- Low[y]>=barheight*Point && showheightline)
          {
               ObjectCreate("UP"+y,  OBJ_VLINE,0,0,0);
               ObjectSet("UP"+y, OBJPROP_TIME1, Time[y]);
               ObjectSet("UP"+y, OBJPROP_COLOR, Blue);
               ObjectSet("UP"+y, OBJPROP_STYLE, 1);
               ObjectSet("UP"+y, OBJPROP_WIDTH, 0);
          }

   if(cci>=100)
       {
         chan=0;
         if(cci>=highest)
            {
               highest=cci;high=cci;
                  if(cci>=lasthigh)
                     {

                         newhigh=cci; bar=y;
                     if (arrow)
                         continue;
                    else {
                           uparrow[bar]=newhigh;

                           if(showarrowline)
                            {
                              ObjectCreate("UP"+bar,OBJ_VLINE,0,0,0);
                              ObjectSet("UP"+bar, OBJPROP_TIME1, Time[bar]);
                              ObjectSet("UP"+bar, OBJPROP_COLOR, Blue);
                              ObjectSet("UP"+bar, OBJPROP_STYLE, 2);
                              ObjectSet("UP"+bar, OBJPROP_WIDTH, 0);
                            }
                          if(sound&&bartime!=Time[bar])PlaySound( "alert2.wav");bartime=Time[bar];
                        }
                     }
                  else
                     {
                        newhigh=0;continue;
                     }
            }
        else   continue;
      }
   else
      {
         if(chan==1) {}//continue;
       else
          {
            lasthigh=high; highest=0;arrow=false;
             //  if(newhigh>0)
               //  uparrow[bar]=newhigh;
            chan=1;// continue;
          }
      }

  // get last new lows
    if(cci<=-100)
      {
         chan2=0;
         if(cci<=lowest)
            {
               lowest=cci;low=cci;
                  if(cci<=lastlow)
                     {
                        newlow=cci; bar=y;
                        if(arrow2)continue;
                   else   {
                           downarrow[bar]=newlow;
                    if(showarrowline){       ObjectCreate("SELL"+bar,OBJ_VLINE,0,0,0);
                  ObjectSet("SELL"+bar, OBJPROP_TIME1, Time[bar]);
                  ObjectSet("SELL"+bar, OBJPROP_COLOR, Red);
                  ObjectSet("SELL"+bar, OBJPROP_STYLE, 2);
                  ObjectSet("SELL"+bar, OBJPROP_WIDTH, 0);}
                 if(sound&&bartime!=Time[bar])PlaySound("alert2.wav");bartime=Time[bar];}
                     }
                  else
                     {
                        newlow=0;continue;
                     }
            }
        else   continue;
      }
   else
      {
         if(chan2==1) continue;
       else
          {
            lastlow=low; lowest=0;arrow2=false;
             //  if(newlow<0)
               //   downarrow[bar]=newlow;
            chan2=1; continue;
          }
      }

    }


   return(0);
  }
//+------------------------------------------------------------------+
Comments