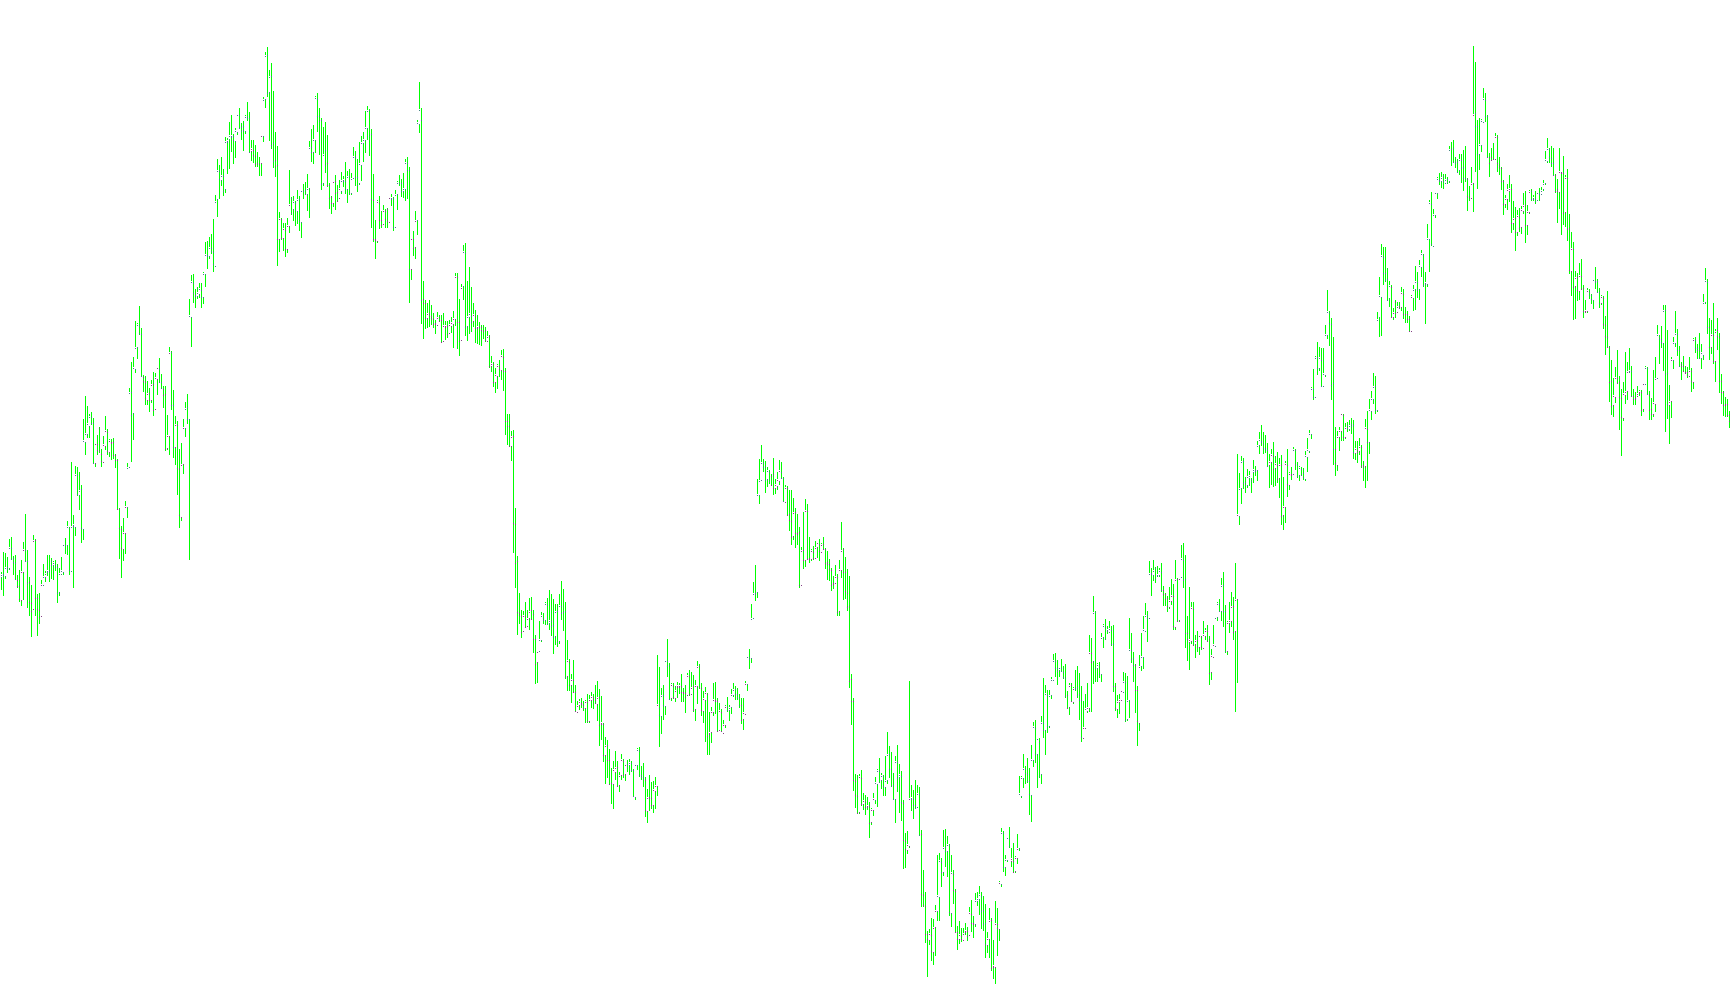
This visual tool is designed to enhance your trading charts by providing a clearer perspective on short-term price movements. It operates by identifying specific "swings" in the market and translating that data into a customized visual overlay that highlights current price action more effectively than standard candle formats.
Core Logic and Functionality
The primary objective of this script is to differentiate between upward and downward trends with distinct visual layers. Here is how it processes information:
- Swing Detection: The indicator references an underlying calculation method (ClearMethod) to determine the current direction of the market. It checks whether the price is currently experiencing an "up swing" or a "down swing."
- Dynamic Visual Rendering: Once a swing direction is identified, the script automatically assigns specific colors and coordinates to the chart:
- Upward Trends: The tool applies a specific set of colors (typically muted teal/blue shades) to represent bullish movement.
- Downward Trends: It switches to a different color palette (typically purple/magenta shades) to signify bearish pressure.
- Smart Color Adaptation: The script includes a toggle for users with dark-themed charts. It detects whether you are using a black background and adjusts the interior fill colors automatically—swapping between white, black, and vibrant highlights—to ensure that the data remains readable regardless of your personal workspace setup.
- Price Mapping: Rather than just drawing simple lines, the logic calculates the exact coordinates for "fills" and "outlines." It looks at the relationship between the Open and Close prices of each candle to decide how much of the bar should be filled with a solid color versus how much should be left as an outline.
How it improves your view
By using this logic, the chart moves away from standard, cluttered candles. Instead, it creates a streamlined visual experience where the "body" of the price movement is highlighted based on its trend direction. This allows traders to see the momentum of short-term swings more intuitively, making it easier to identify shifts in market sentiment at a glance.
// This indicator is based on the article: Getting Clear With Short-Term Swings by Ron Black
//
// http://www.traders.com/Documentation/FEEDbk_docs/2010/09/Black.html
// http://www.traders.com/Documentation/FEEDbk_docs/2010/09/TradersTips.html
//
// To set up colored candle charts:
// - switch to Line Chart
// - in Chart Properties window, set Line Chart Color to None (the entire price graph will disappear)
// - copy the ClearMethod.mq4 file to the Indicator directory, it will be used by iCustom()
// - add ClearMethodCandles1 (this must be the first), then ClearMethodCandles2 to the chart
// - if you use black backgrounded chart, set IsBlackChart parameter to true for both indicator

#property indicator_chart_window

#property indicator_buffers 6
#property indicator_color1 White
#property indicator_color2 Black
#property indicator_color3 C'64, 128, 128'
#property indicator_color4 C'128, 64, 128'
#property indicator_color5 C'64, 128, 128'
#property indicator_color6 C'128, 64, 128'

#property indicator_width1 2
#property indicator_width2 2
#property indicator_width3 3
#property indicator_width4 3
#property indicator_width5 3
#property indicator_width6 3

int maxHistoryBarsToCount = 50000;

extern bool IsBlackChart = false;

color UpSwingOutlineColor;
color DownSwingOutlineColor;
color UpCandleInsideColor;
color DownCandleInsideOnBlackCharts;

double CandleInsideFillBuffer1[];
double CandleInsideFillBuffer2[];
double CandleHighEndBuffer1[];
double CandleHighEndBuffer2[];
double CandleLowEndBuffer1[];
double CandleLowEndBuffer2[];

int init() {
   if (IsBlackChart) {
      UpSwingOutlineColor = Lime;
      DownSwingOutlineColor = Orange;
      UpCandleInsideColor = Black;
      DownCandleInsideOnBlackCharts = White;
   } else {
      UpSwingOutlineColor = C'64, 128, 128';
      DownSwingOutlineColor = C'128, 64, 128';
      UpCandleInsideColor = White;
      DownCandleInsideOnBlackCharts = Black;
   }
   SetIndexStyle(0, DRAW_HISTOGRAM, STYLE_SOLID, EMPTY, UpCandleInsideColor);
   SetIndexBuffer(0, CandleInsideFillBuffer1);
   SetIndexStyle(1, DRAW_HISTOGRAM, STYLE_SOLID, EMPTY, DownCandleInsideOnBlackCharts);
   SetIndexBuffer(1, CandleInsideFillBuffer2);
   SetIndexStyle(2, DRAW_HISTOGRAM, STYLE_SOLID, EMPTY, UpSwingOutlineColor);
   SetIndexBuffer(2, CandleHighEndBuffer1);
   SetIndexStyle(3, DRAW_HISTOGRAM, STYLE_SOLID, EMPTY, DownSwingOutlineColor);
   SetIndexBuffer(3, CandleHighEndBuffer2);
   SetIndexStyle(4, DRAW_HISTOGRAM, STYLE_SOLID, EMPTY, UpSwingOutlineColor);
   SetIndexBuffer(4, CandleLowEndBuffer1);
   SetIndexStyle(5, DRAW_HISTOGRAM, STYLE_SOLID, EMPTY, DownSwingOutlineColor);
   SetIndexBuffer(5, CandleLowEndBuffer2);

   SetIndexEmptyValue(0, 0.0);
   SetIndexEmptyValue(1, 0.0);
   SetIndexEmptyValue(2, 0.0);
   SetIndexEmptyValue(3, 0.0);
   SetIndexEmptyValue(4, 0.0);
   SetIndexEmptyValue(5, 0.0);

   return(0);
}

int start() {
   int countedBars = IndicatorCounted();
   int countFrom = MathMin(Bars - countedBars - 1, maxHistoryBarsToCount);

   if (countFrom >= 0 && countFrom < Bars) {
      countIndicator(countFrom);
   }
   return(0);
}

int countIndicator(int countFrom) {
   int i;
   bool isUpSwing;

   for (i = countFrom; i >= 0; i--) {
      isUpSwing = (iCustom(NULL, 0, "ClearMethod", 0, i) > 0);
      if (isUpSwing) {
         CandleHighEndBuffer1[i] = Close[i];
         CandleHighEndBuffer2[i] = Close[i] - Point / 10000.0;
         CandleLowEndBuffer1[i] = Open[i] + Point / 10000.0;
         CandleLowEndBuffer2[i] = Open[i];
      } else {
         CandleHighEndBuffer1[i] = Close[i] - Point / 10000.0;
         CandleHighEndBuffer2[i] = Close[i];
         CandleLowEndBuffer1[i] = Open[i];
         CandleLowEndBuffer2[i] = Open[i] + Point / 10000.0;
      }

      if (Open[i] < Close[i]) {
         CandleInsideFillBuffer1[i] = Close[i];
         CandleInsideFillBuffer2[i] = Open[i];
      } else if (Open[i] > Close[i] && IsBlackChart) {
         CandleInsideFillBuffer1[i] = Close[i];
         CandleInsideFillBuffer2[i] = Open[i];
      } else {
         CandleInsideFillBuffer1[i] = 0.0;
         CandleInsideFillBuffer2[i] = 0.0;
      }
   }
   return(0);
}
Comments