Cleon Heiken Ashi
Download script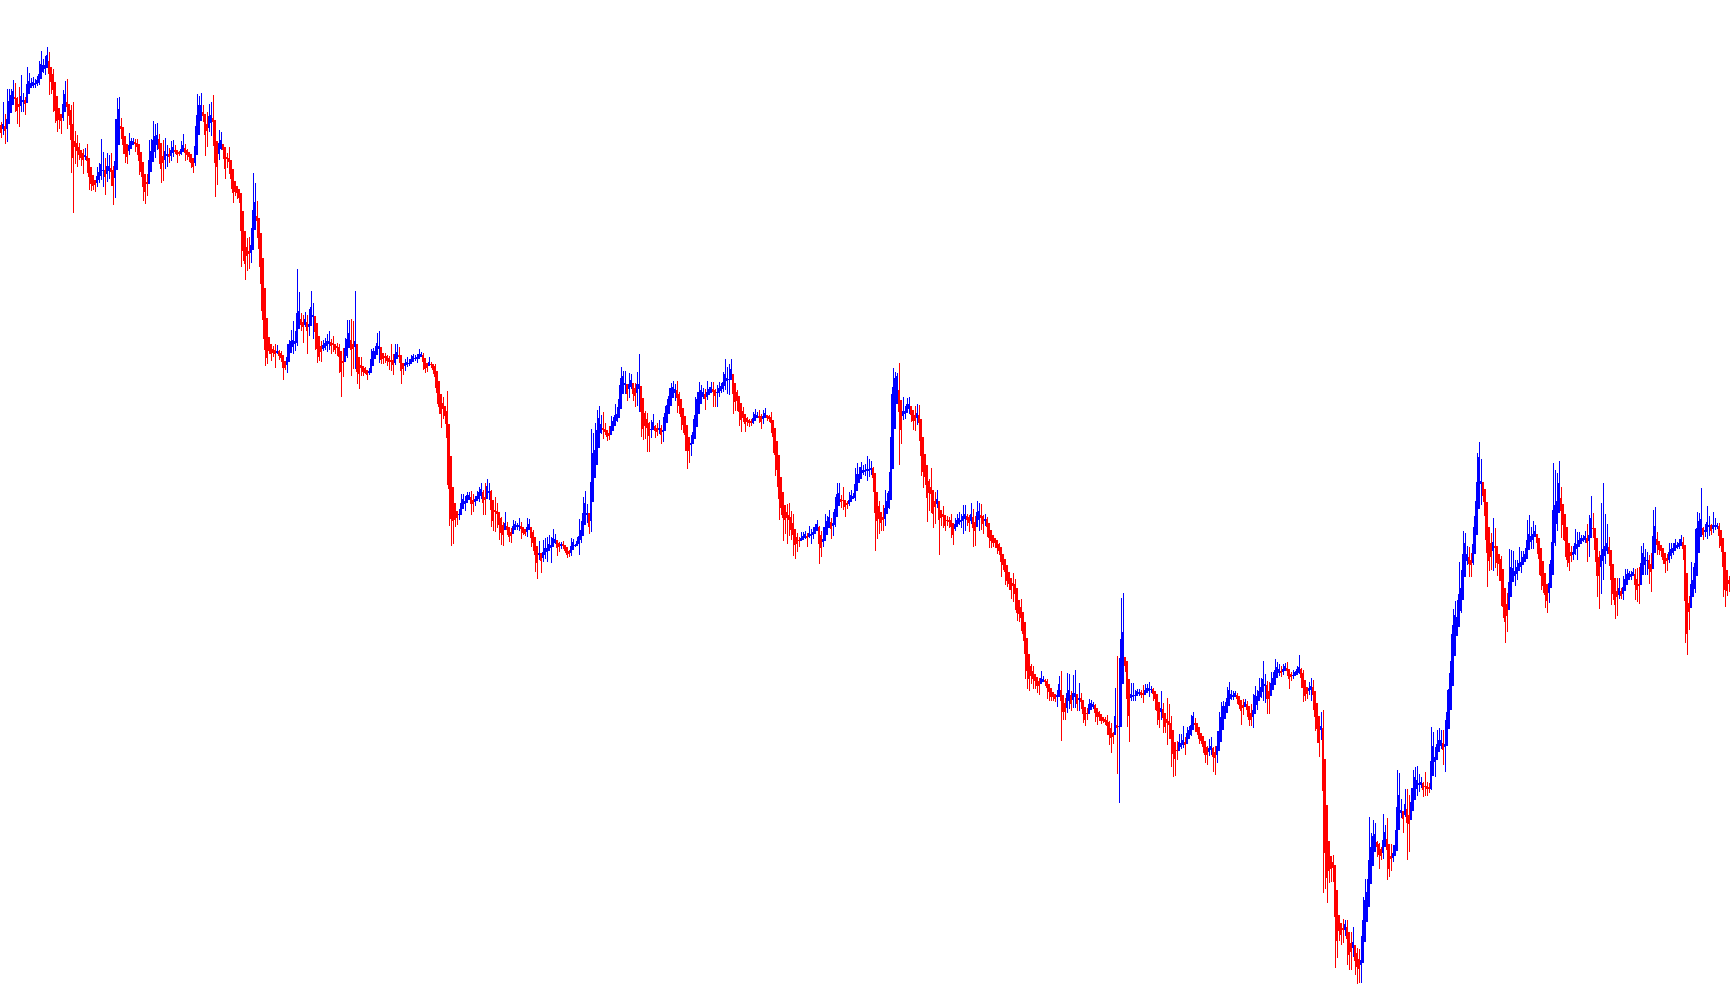
This script is designed to transform standard price action charts into a specialized visual format known as Heiken Ashi. While traditional trading charts show the raw price movement from one minute (or hour/day) to the next, this tool smooths out that data to help traders identify the underlying trend more clearly by filtering out minor market "noise."
How the Logic Works
Instead of simply plotting the price as it happens, the script performs a specific set of mathematical calculations to redefine what each "candle" on your screen represents. It treats every new candle as a blend of both the current and previous data points:
- Smoothing the Price: The script calculates a new "closing price" by taking the average of the current period's High, Low, Open, and Close prices. This provides a balanced view of where the price actually settled.
- Redefining the Opening Price: To ensure the movement looks fluid rather than jumpy, the script sets the "opening price" of a candle as the halfway point between the previous candle's opening and closing prices.
- Dynamic Highs and Lows: The script then determines the boundaries of each candle. It compares the actual market highs and lows against the newly calculated open and close values, ensuring that the visual "wicks" (the thin lines on candles) accurately reflect the extremes reached during that period.
Visual Representation
The logic translates these numbers into a color-coded histogram:
- Trend Identification: When the calculated closing price is higher than the opening price, it indicates upward momentum (traditionally shown in Blue).
- Opposing Momentum: When the closing price is lower than the opening price, it indicates downward momentum (traditionally shown in Red).
The Benefit to the User
By using this logic, the chart becomes less cluttered. Because each candle is mathematically linked to the one before it, the resulting visual shows a much smoother transition of price movement. This makes it significantly easier for a trader to see whether the market is trending up, down, or moving sideways without getting distracted by every tiny, insignificant price fluctuation.
//+------------------------------------------------------------------+
//|                                                  Heiken Ashi.mq4 |
//|                      Copyright c 2004, MetaQuotes Software Corp. |
//|                                        http://www.metaquotes.net |
//+------------------------------------------------------------------+
#property copyright "Copyright © 2004, MetaQuotes Software Corp."
#property link      "http://www.metaquotes.net"

#property indicator_chart_window
#property indicator_buffers 4
#property indicator_color1 Red
#property indicator_color2 Blue
#property indicator_color3 Red
#property indicator_color4 Blue

//---- buffers
   double
      ExtMapBuffer1[],
      ExtMapBuffer2[],
      ExtMapBuffer3[],
      ExtMapBuffer4[];

//---- vars
   int
      ExtCountedBars=0;

int init() {

   //---- indicators
   SetIndexStyle  (0, DRAW_HISTOGRAM, 0, 1, Red);
   SetIndexBuffer (0, ExtMapBuffer1);
   SetIndexLabel  (0, "HA Max / Min");
   SetIndexStyle  (1, DRAW_HISTOGRAM, 0, 1, Blue);
   SetIndexBuffer (1, ExtMapBuffer2);
   SetIndexLabel  (1, "HA Max / Min");
   SetIndexStyle  (2, DRAW_HISTOGRAM, 0, 3, Red);
   SetIndexBuffer (2, ExtMapBuffer3);
   SetIndexLabel  (2, "HA Open");
   SetIndexStyle  (3, DRAW_HISTOGRAM, 0, 3, Blue);
   SetIndexBuffer (3, ExtMapBuffer4);
   SetIndexLabel  (3, "HA Close");

   //----
   SetIndexDrawBegin(0, 10);
   SetIndexDrawBegin(1, 10);
   SetIndexDrawBegin(2, 10);
   SetIndexDrawBegin(3, 10);

   //---- indicator buffers mapping
   SetIndexBuffer(0, ExtMapBuffer1);
   SetIndexBuffer(1, ExtMapBuffer2);
   SetIndexBuffer(2, ExtMapBuffer3);
   SetIndexBuffer(3, ExtMapBuffer4);

   IndicatorDigits(Digits);
   return(0);
}

//+------------------------------------------------------------------+
//| Custom indicator iteration function                              |
//+------------------------------------------------------------------+
int start() {

   double
      haOpen,
      haHigh,
      haLow,
      haClose;

   int
      pos = Bars - ExtCountedBars - 1;

   if( Bars <= 10 ) {
      return(0);
   }
   ExtCountedBars = IndicatorCounted();
   //---- check for possible errors
   if ( ExtCountedBars < 0 ) {
      return(-1);
   }
   //---- last counted bar will be recounted
   if ( ExtCountedBars > 0 ) {
      ExtCountedBars--;
   }

   while( pos >= 0 ) {
      haOpen   = (ExtMapBuffer3[pos + 1] + ExtMapBuffer4[pos + 1]) / 2;
      haClose  = (Open[pos] + High[pos]  + Low[pos] + Close[pos])  / 4;
      haHigh   = MathMax(High[pos], MathMax(haOpen, haClose));
      haLow    = MathMin(Low[pos],  MathMin(haOpen, haClose));
      if ( haOpen < haClose) {
         ExtMapBuffer1[pos] = haLow;
         ExtMapBuffer2[pos] = haHigh;
      } else {
         ExtMapBuffer1[pos] = haHigh;
         ExtMapBuffer2[pos] = haLow;
      }
      ExtMapBuffer3[pos] = haOpen;
      ExtMapBuffer4[pos] = haClose;
 	   pos--;
   }
   return(0);
}
Comments